Looking for value in Canadian equity ETFs
FXM's recent performance has been outstanding, but it’s hard to know whether it will continue, since it’s not clear where returns are coming from.
Advertisement
FXM's recent performance has been outstanding, but it’s hard to know whether it will continue, since it’s not clear where returns are coming from.
 Two decades of research has shown that the returns of a diversified equity portfolio can largely be explained by its exposure to three factors: the market premium, the value premium, and the size premium. A broad-market index fund like the iShares S&P/TSX Capped Composite (XIC), by definition, should be neutral in its exposure to the value and size premiums. And as we saw in my previous post, it is: the value and size coefficients for XIC are negligible. So, on to the next step.
Let’s now take a look at the iShares Dow Jones Canadian Value (XCV) and the iShares S&P/TSX Small Cap (XCS). We should obviously expect XCV to have extra exposure to the value factor, while XCS should capture the size premium. Here are the results of a factor analysis covering the five years from 2008 through 2012:

Turns out XCV does indeed show a significant value tilt, with a value coefficient of 0.3589. To put that in context, during a period when value stocks outperform growth stocks by 2%, this fund would be expected to outperform the market by about 0.72% (0.3589 x 2%).
On the other hand, the fund’s size coefficient is significantly negative. That’s not surprising considering the Big Five banks make up almost 40% of its holdings. During a period when small caps outperform large caps by 2% you would expect XCV to underperform the market by about 0.79% (–0.3930 x 2%). Moving on to XCS, we see the fund has a predictably huge small-cap tilt, as shown by its size coefficient of 0.9260. The only surprise here is the fund’s negative alpha—and a pretty high one at that. Management fees will have some impact here, but they’re not enough to account for a drag of 0.4477% per month. Unfortunately, when a factor analysis shows negative alpha we know something is causing a drag on returns, but we can never be sure what that is.
What do you know? Both ETFs show an even larger value tilt than XCV. As Justin Bender argued on his blog last year, dividend ETFs can be thought of as “value ETFs in disguise.” (Larry Swedroe goes into more detail on this subject here.) Think of it like this: a stock’s yield is its dividend amount divided by its price. Many dividend junkies focus on the numerator in that fraction (the high dividend amount), but the real driver of the returns is the denominator: the lower price.
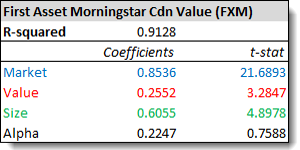
Fundamental indexing, too, is really just a methodology designed to get greater exposure to value stocks, something its critics have long noted. (In countries with larger and more diversified stock markets, it tends to capture some small-cap premium as well.) Research Affiliates, creators of the fundamental index, downplayed this for long time, but now they seem to acknowledge it freely. During the five years ending in 2012, the iShares Dow Jones Canadian Value (XCV) returned 2.93% annually, falling between XDV and CRQ. That’s not a coincidence. All three funds are just different ways of tapping into the value premium, which was strongly positive during these five years. When the value premium is negative during other periods, you can probably expect these funds to struggle in similar ways. Yes, there’s value tilt, but there’s also a huge—and statistically significant—size tilt as well. (Remember, in the three value funds we considered above, the size coefficients were negative.) There’s also a significant alpha, though the low t-stat indicates it may just be random noise. But however you slice it, FXM is more than just a value fund.
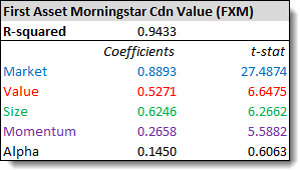
We decided to dig a little deeper. Though it’s notoriously difficult to harness, there’s lots of evidence for a fourth factor: the momentum premium. Stocks that have recently risen or fallen in price tend to persist in the same direction for some time. So we ran a new regression with this fourth factor thrown into the mix:
 This definitely helped: the higher R-squared value suggests the data fit this model better than our three-factor analysis. Momentum does indeed seem to contribute to the excess return. (In the Morningstar index tracked by FXM, one of the criteria for is three-month earnings estimate revisions, which is a traditional momentum screen.) The value coefficient is higher now, too, but the size coefficient is still unexpectedly large.
Nathan Stretch—the reader who first encouraged us to look at FXM—ran his own regressions using different factor data and found even less evidence of value exposure and even more unexplained alpha. The truth is, it’s hard to know what’s going on here. FXM certainly has a very different sector mix: while the three value ETFs above are dominated by the Big Five banks, FXM includes exactly none of them. If the fund were actively managed, you might attribute some of its outperformance to stock-picking skill. Since it’s not, it may just be luck.
Bottom line, FXM bears no resemblance to the other value funds we’ve considered here. While its recent performance has been outstanding, it’s hard to know whether it will continue, since it’s not clear where those outsized returns are coming from.
Note: Once again, thanks to Justin Bender and Nathan Stretch for their help with these factor analyses. If you’re interested in learning how to “roll your own,” see Justin’s new blog post, How to Run a 3-Factor Regression Analysis.
Share this article Share on Facebook Share on Twitter Share on Linkedin Share on Reddit Share on Email