A scientific review of portfolio diversification
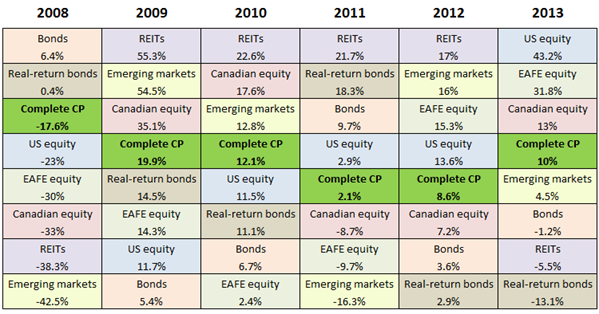
This periodic table of returns for seven individual asset classes shows the balanced Couch Potato portfolio fell near the middle every time.
Advertisement
This periodic table of returns for seven individual asset classes shows the balanced Couch Potato portfolio fell near the middle every time.
After the financial crisis of 2008–09, financial commentators loved to take shots at “old school” investment strategies. First came the declarations that diversification no longer works, because during a crisis everything goes down together—though this wasn’t true in 2008 unless you ignored bonds, which make up a significant part of most portfolios. Then the investment industry sounded the death knell for the traditional balanced portfolio. Apparently we were in a new era where active investing, tactical asset allocation and alternative asset classes would rule the day.
One of the most effective ways to expose this nonsense is to build a “periodic table” of investment returns. (Norm Rothery has maintained one on his Stingy Investor site for several years.) The resemblance to the poster that hung in your high-school chemistry class is only superficial: this table simply presents the returns of various asset classes ordered from highest to lowest over a period of several years. By adding a colour for each asset class, the results jump off the screen.
I thought it would be interesting to build a periodic table with the returns of the seven individual asset classes in the Complete Couch Potato, as well as the returns for the whole portfolio. Here’s what the results look like for the last six years:
Periodic tables almost never show any discernible pattern. In some cases, the best performer in one year becomes one of the worst in the next, or vice-versa, which is an argument for rebalancing. But it’s never that simple. If you declared REITs overvalued after their 2009 run-up, for example, you missed another three outstanding years. If you feared rising interest rates after 2008, you missed four strong years of great bond returns. It’s impossible to imagine how anyone could have consistently predicted which asset classes would have ended up at the top or bottom of next year’s column based on past performance, economic forecasts or traditional valuation methods.
It’s not surprising to find the balanced Couch Potato portfolio fell near the middle every time—that’s exactly what you’d expect. More interesting is that each individual asset class finished above the balanced portfolio at least twice, and below it at least twice. With the exception of bonds, all of these assets classes showed significant volatility: emerging markets, REITs and real-return bonds in particular. And yet when these volatile asset classes are combined, the result is the dramatically lower volatility of the portfolio as a whole.
Diversification doesn’t work? The traditional balanced portfolio is dead? Seems to me these old ideas have never been more relevant or useful for investors. It’s the forecasters and the tactical asset allocators who have the explaining to do.
Data in the above table were supplied by Libra Investment Management, except for REITs, which are based on the S&P/TSX Capped REIT Index. All returns are in Canadian dollars. Returns for the Complete Couch Potato were calculated using the methodology described here.
Share this article Share on Facebook Share on Twitter Share on Linkedin Share on Reddit Share on Email