
Monday’s post comparing one of my model ETF portfolios to one created by Dimensional Fund Advisors attracted a lot of interest from readers—and from some DFA advisors, too.
Shortly after that post went live, I was contacted by a DFA advisor whom I’ll call John (his compliance department keeps him on a short leash). John ran some numbers to compare how the original Über-Tuber might have performed alongside a DFA portfolio over the last 15 years.
Of course, none of the ETFs in my suggested portfolio were around in 1996. So John used index data to estimate the returns of the Über-Tuber, subtracting the MERs of the funds to account for costs. For the DFA portfolio, he subtracted a 1% advisory fee from the fund returns. Here’s the breakdown he used:
| Index |
Über-Tuber |
DFA
|
| Canadian One-Month T-Bills |
20% |
20% |
| Dex Cdn Bond Universe Index |
20% |
20% |
| S&P TSX Composite Index |
4.8% |
– |
| Barra Canadian Value Index |
7.2% |
– |
| DFA Canadian Core Index |
– |
20% |
| Barra Canadian Small Index |
8% |
– |
| DFA U.S. Vector Index |
– |
18% |
| Russell 2000 Value Index |
8% |
– |
| Russell 1000 Value Index |
10% |
– |
| DFA International Vector Index |
– |
14% |
| MSCI World (ex. U.S.) Index |
4% |
– |
| MSCI EAFE Value Index |
10% |
– |
| S&P Global REIT Index |
4% |
4% |
| MSCI Emerging Market Index |
4% |
4% |
|
100% |
100% |
|
|
|
Here are the results from July 1996 through April 2011:
|
Annualized |
Total |
Growth |
Standard |
|
Return |
Return |
of $1 |
Deviation |
| Über-Tuber |
6.36% |
149.53% |
$2.50 |
7.82% |
| DFA Portfolio |
6.42% |
151.57% |
$2.52 |
8.14% |
|
|
|
|
|
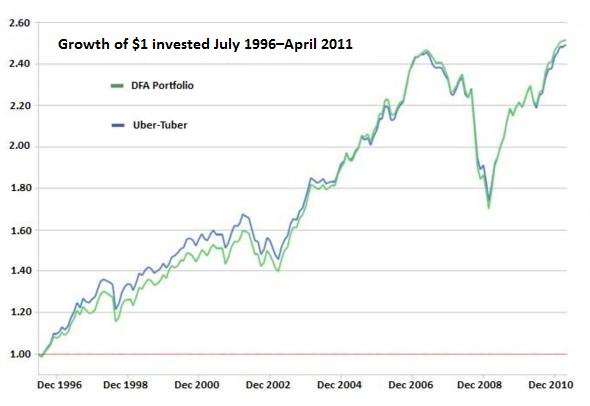
And here’s how the path of those returns would have looked during the period:

As you’ll see, the returns of the two portfolios over the 15 years were almost identical. The Über-Tuber trailed the DFA portfolio by just half a dozen basis points annually, and it accomplished that result with a lower standard deviation—which means lower volatility.
What’s it all mean?
So what conclusions can we draw from these data? First, it seems the ETF portfolio would have done a respectable job of mirroring DFA’s small-cap and value strategies. However, the simulation assumed that trading costs were zero, that the investor rebalanced religiously, and that the ETFs all tracked their indexes very closely. It’s safe to say that a real-world investor would have been hard-pressed to accomplish all of that.
What’s more, assuming our ETF investor did manage to do everything right for 15 years, the DFA portfolio still delivered slightly better results, even after deducting a 1% fee for the advisor. An experienced advisor would certainly have added value if he or she handled all of the heavy lifting during this turbulent period, which included three roaring bull markets (1996–2000, 2003–06 and 2009–10) and two swift kicks in the groin (2001–02 and 2008–09).
There’s one more interesting thing to add. John also ran the same simulation with the trusty old Global Couch Potato—which includes just three or four funds—and the results fell right in the middle: an annualized return of 6.40%. There was a bit of divergence between the three portfolios during some periods, but after 15 years it was essentially a wash, no matter which one you used.
Maybe it does pay to keep things simple after all: diversify widely, keep your costs low, rebalance and stick to your plan. If you can do that, you’re at least 90% of the way to the perfect portfolio.


