Don’t sweat the small asset allocation details
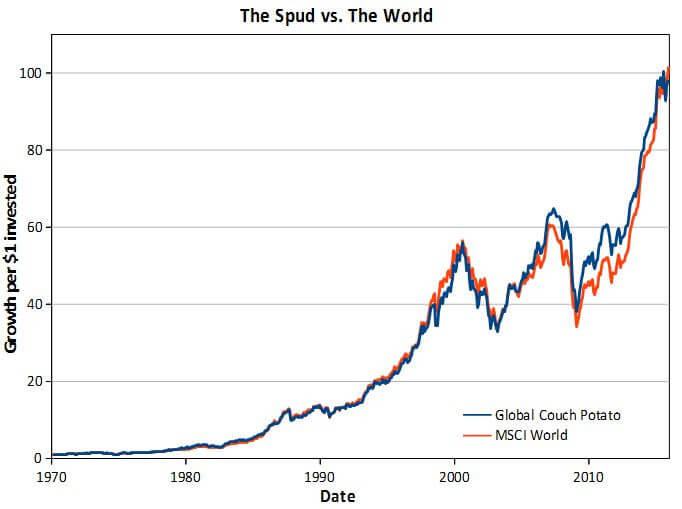
Two very opposing equity allocations haven't affected returns much over the decades
Advertisement
Two very opposing equity allocations haven't affected returns much over the decades
 The situation changes more noticeably if you look at the classic couch potato portfolio, which eliminates international stocks entirely. The graph below shows how it fares against the world index.
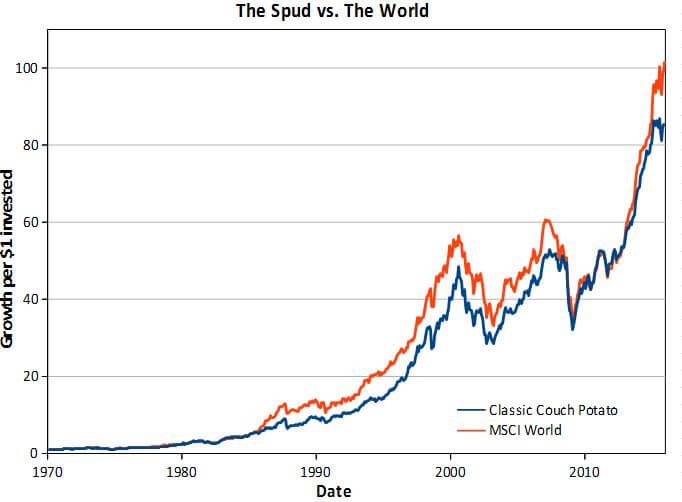 But even in this extreme instance, the returns between the two haven’t been too far off. For instance, in the early part of this decade the classic couch potato was basically running neck and neck with the world index.
I prefer the global variant of the global couch potato, which is more diversified than the classic version. But, based on past history, you probably shouldn’t worry too much if you have, say, an extra 5% devoted to Canadian stocks and proportionately less in U.S. and international stocks.
But even in this extreme instance, the returns between the two haven’t been too far off. For instance, in the early part of this decade the classic couch potato was basically running neck and neck with the world index.
I prefer the global variant of the global couch potato, which is more diversified than the classic version. But, based on past history, you probably shouldn’t worry too much if you have, say, an extra 5% devoted to Canadian stocks and proportionately less in U.S. and international stocks.
| Name | Price | P/B | P/E | Earnings Yield | Dividend Yield |
|---|---|---|---|---|---|
| National Bank (NA) | $42.68 | 1.54 | 10.49 | 9.54% | 5.06% |
| CIBC (CM) | $96.87 | 1.84 | 10.72 | 9.33% | 4.87% |
| Shaw (SJR.B) | $25.01 | 2.27 | 14.21 | 7.04% | 4.74% |
| Bank of Nova Scotia (BNS) | $62.48 | 1.48 | 10.79 | 9.27% | 4.61% |
| BCE (BCE) | $59.85 | 3.98 | 20.08 | 4.98% | 4.56% |
| Royal Bank (RY) | $74.76 | 1.76 | 11.21 | 8.92% | 4.33% |
| Bank of Montreal (BMO) | $78.67 | 1.32 | 11.71 | 8.54% | 4.27% |
| Power (POW) | $29.73 | 1.05 | 7.71 | 12.97% | 4.19% |
| TELUS (T) | $42.07 | 3.26 | 18.37 | 5.44% | 4.18% |
| Manulife (MFC) | $17.99 | 0.92 | 16.97 | 5.89% | 4.11% |
Share this article Share on Facebook Share on Twitter Share on Linkedin Share on Reddit Share on Email

Find the best GIC rates in Canada. Plus, everything you need to know about how they work.

Which ETFs should you invest in? Which ones best suit your risk tolerance? What about personal ethics? Check out...

In the likelihood of a protracted conflict, these experts think people in or close to retirement need to review...

Look under the hood before buying some popular Canadian sector ETFs. There may be alternatives that better represent the...

Lululemon profits dip, Couche-Tard surges, and Power Corp declines. Here’s what investors need to know about Q4 results...

U.S.-Iran tensions have shaken markets, but experts urge investors to stay disciplined, avoid emotional moves, and use volatility to...

Canadian companies face a turbulent quarter, with Algoma Steel losing big and Transat posting gains amid major corporate moves.

Canadians moving to the U.S. may be able to unlock a locked-in RRSP after 24 months of non-residency—but tax...

Q4 shows mixed results across sectors: Canadian Natural and Pet Valu post gains, while George Weston and Canada Packers...

Bitcoin extends losses, down 47% since October 2025. When will the crypto bear market reverse, and what does the...