Cap-weighted vs. equal-weighted ETFs: Which is best for Canadian investors?
Technology mega-caps are looking less magnificent. Is it time to adopt a different indexing strategy? Let’s explore the pros and cons.
Advertisement
Technology mega-caps are looking less magnificent. Is it time to adopt a different indexing strategy? Let’s explore the pros and cons.

With over 1,400 exchange-traded funds (ETFs) available in Canada, sometimes looking for a benchmark index can help you choose. But what about how the index ETF is weighted? When you think about the world’s most-followed stock indexes like the Nasdaq-100 and the S&P 500, you’re looking at lists of companies organized by market capitalization. Essentially, the larger a company’s market cap—the total value of its outstanding shares multiplied by the current share price—the bigger its weight will be within the index. Many indexes also adjust this for “free float,” considering only shares available to the public and excluding those held by insiders.
But as the adage goes, there’s more than one way to skin a cat—or in this case, to weight an index. With the growing dominance of the Magnificent 7 tech giants—Alphabet, Amazon, Apple, Microsoft, Nvidia, Meta and Tesla—some Canadian investors are raising eyebrows at the potential concentration risk in these cap-weighted indexes. While these stocks have mostly boosted the returns of the S&P 500 over the past decade—hence their “magnificence”—their performance in 2024 has been mixed. So, many investors now fear they may be facing a comeuppance. They see a need to rotate into hitherto less glamorous stocks and sectors that may be set to outperform.
Enter the concept of equal-weighted indexes, which hold all the stocks in the index in roughly equal amounts.
Is this alternative approach the right solution? Is it a panacea for perceived market imbalances or merely a placebo? Here are the pros and cons from both sides of the market-cap-versus-equal-weight debate.
Proponents of the equal weighting approach champion its straightforward and transparent method to mitigate concentration risk in investment portfolios.
Consider the composition of the cap-weighted SPDR S&P 500 ETF Trust (SPY), which is 31% skewed towards the technology sector. This percentage doesn’t even include tech-adjacent giants like Amazon and Tesla, along with Google and Meta, which are categorized under consumer discretionary and communications, respectively.
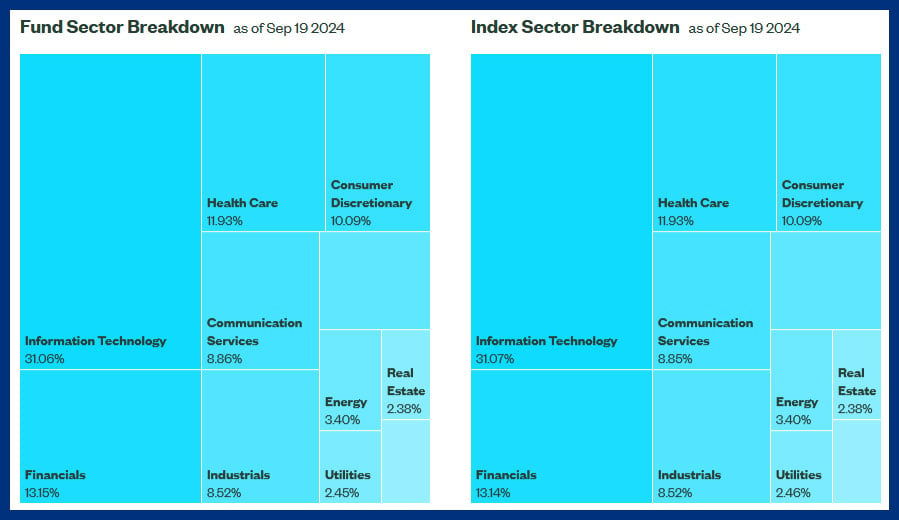
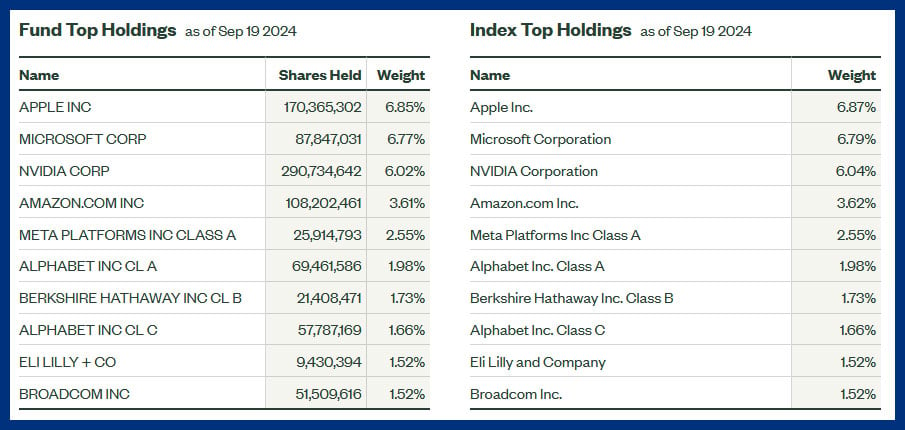
The ETF is also top-heavy, with its top 10 holdings making up over a third of the ETF’s total weight at 34%. This concentration can be risky. If one or more of these major players falters, it has the potential to pull down the entire index fund, irrespective of how other sectors or the broader economy is performing.
Take the example of Nortel Networks. At its peak in 2000, it accounted for more than 30% of the TSE 300, the leading Canadian index at the time. That turned into a headwind for the entire index as Nortel unravelled in the years to follow.
Another concern is stretched valuations. The current Shiller Cyclically Adjusted PE (CAPE) Ratio or the market-cap weighted S&P 500, which stands at a hefty 36.81, is significantly higher than the historical median of 15.99.
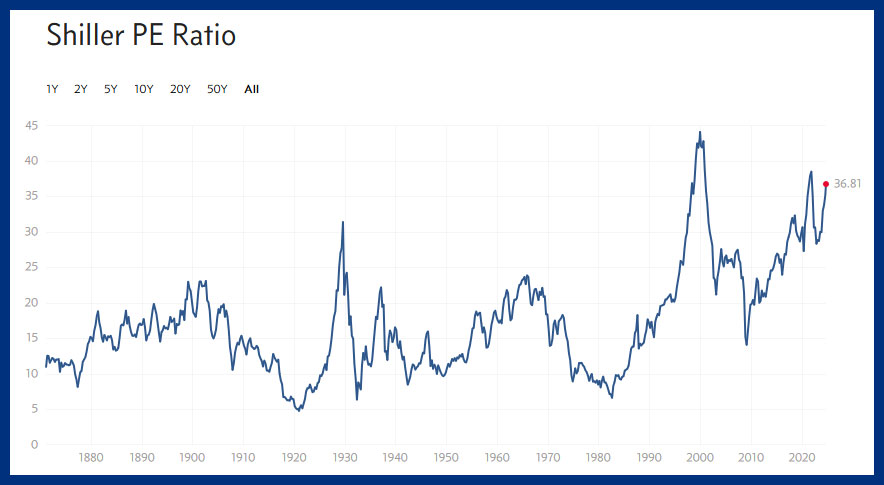
The CAPE Ratio assesses a stock’s price compared to its average earnings over the past 10 years, adjusted for inflation. A high CAPE Ratio suggests that stocks might be overvalued relative to historical earnings, indicating potential downside risks.
The picture isn’t as clear-cut as it seems, however. One of the primary drawbacks of equal weighting, as critics point out, is the additional drag on performance from its methodology.
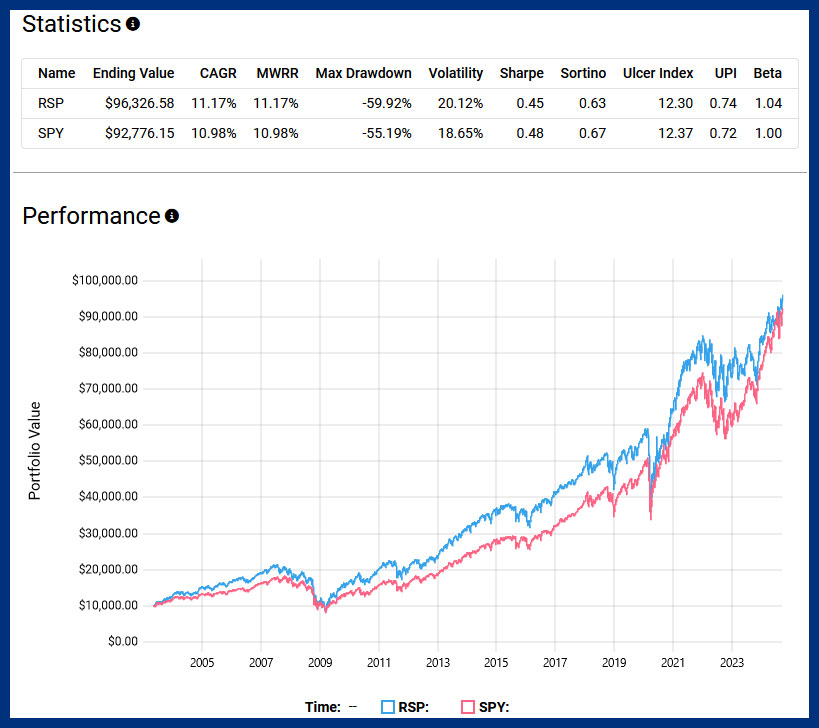
Take the Invesco S&P 500 Equal Weight ETF (RSP) as an example. It has a 21% turnover and a 0.20% expense ratio. The Canadian-listed version is the Invesco S&P 500 Equal Weight Index ETF (EQL, EQL.F). In contrast, SPY maintains a mere 2% turnover and a lower expense ratio of 0.0945%.
While it’s true that RSP outperformed SPY in total returns since its inception in April 2003, the victory isn’t as clear-cut as it might seem. The risk-adjusted return of RSP, indicated by a Sharpe ratio of 0.45, is slightly lower than SPY’s 0.48. What does that mean? It could suggest that RSP took on higher volatility for only marginally better returns. Moreover, RSP experienced a deeper maximum drawdown than SPY. A maximum drawdown measures the largest single drop from peak to trough during a specified period, indicating a higher historical risk of losses for investors.
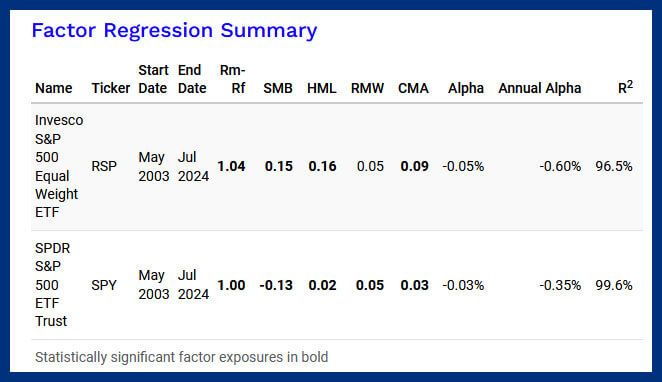
Further analysis via factor regression reveals that most of RSP’s outperformance can be attributed to the size. Essentially, RSP’s equal-weighted methodology has inadvertently skewed its exposure towards smaller and more undervalued companies, which historically have contributed to outperformance.
This raises a critical point: If the goal is to invest in these kinds of companies, wouldn’t it be more straightforward and efficient to target them directly based on fundamental metrics rather than adopting a blanket equal-weighting approach to the entire S&P 500?
I find myself siding with cap weighting now. The primary appeal is simplicity. Market-cap strategies require fewer decisions regarding rebalancing or reconstitution, which in turn keeps sources of friction like turnover and fees considerably lower—resulting in fewer headwinds to performance.
In an ideal frictionless world, the appeal of equal weighting is clear. However, the reality of quarterly rebalancing and higher fees associated with equal-weight ETFs has not historically yielded better risk-adjusted returns over the last two decades.
While proponents of equal weighting argue that this strategy systematically buys low and sells high, it also prematurely cuts off winners. What this means is: as a company’s stock price increases, causing its market cap to grow, the fund will sell some of its shares at each periodic rebalancing to bring it back to an equal weight with other stocks in the index.
In a market where a small proportion of companies often drive the bulk of returns, failing to let winners run can significantly hamper overall performance.
Share this article Share on Facebook Share on Twitter Share on Linkedin Share on Reddit Share on Email