The tail of the bond bull
As well as bonds have performed since the 1980s, investors shouldn't expect much from them going forward
Advertisement
As well as bonds have performed since the 1980s, investors shouldn't expect much from them going forward
SKIP AHEAD

Climbing CATS |
 (The indexes used were the S&P/TSX Composite, S&P 500, MSCI EAFE, and the Canada universe bond index. The portfolio was rebalanced monthly for the ease of calculation, but rebalancing annually doesn’t make a huge difference.)
Sign up for our free investing newsletter »
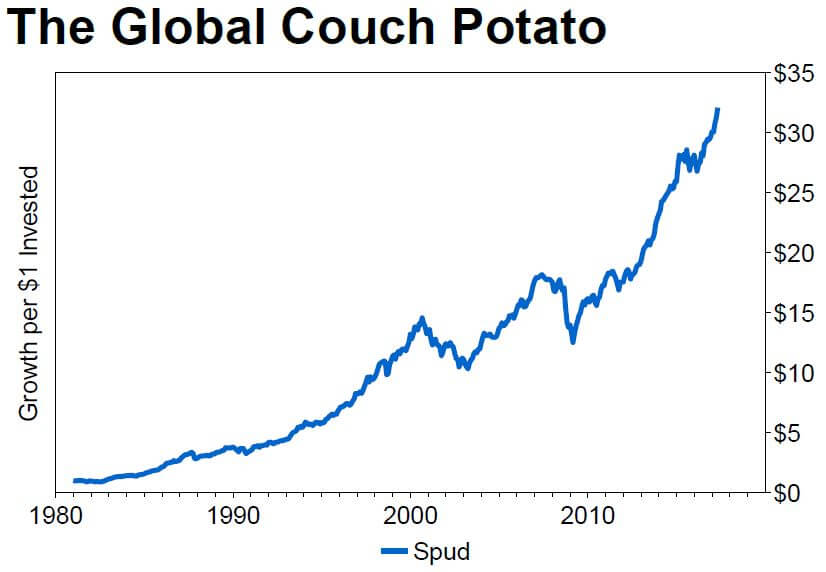
Overall, the gains were pretty good. The portfolio enjoyed a compound annual growth rate of 10.0% from the start of 1981 through to April 30, 2017. But it struggled for years to pull ahead of a portfolio that had invested all of its money in bonds. The following graph shows the return pattern of both the couch potato portfolio and the bond index portfolio.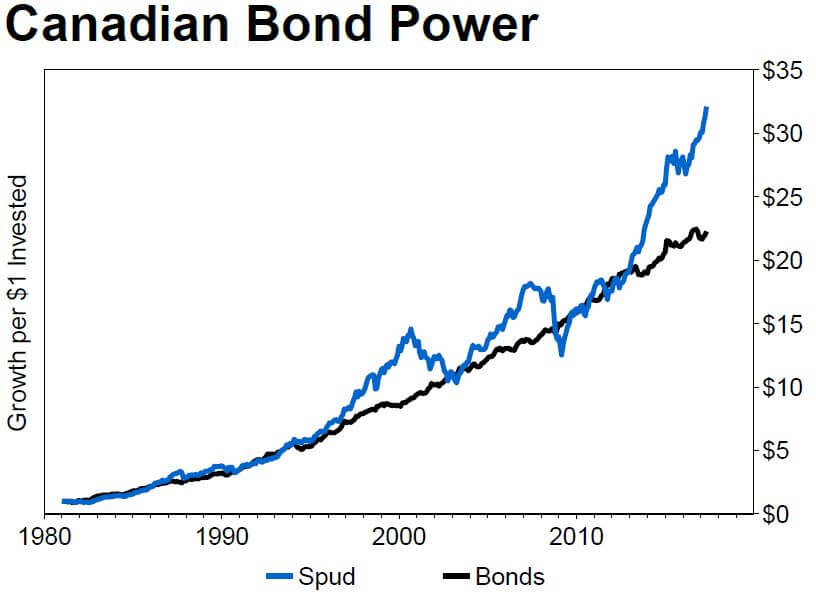 The bond portfolio eventually trailed the couch potato portfolio with an overall compound annual growth rate of 8.9%. But bonds were ahead a few years ago and they might leap ahead again during a bear market.
However, there are a few important things to keep in mind before rushing off to pile into bonds.
First, bonds are generally taxed more onerously than stocks in taxable accounts. While every tax situation is different, generally speaking bond income is taxed at the full marginal rate whereas capital gains, and dividends, from Canadian stocks are taxed at about half that level. The difference can really add up over time.
The bond portfolio eventually trailed the couch potato portfolio with an overall compound annual growth rate of 8.9%. But bonds were ahead a few years ago and they might leap ahead again during a bear market.
However, there are a few important things to keep in mind before rushing off to pile into bonds.
First, bonds are generally taxed more onerously than stocks in taxable accounts. While every tax situation is different, generally speaking bond income is taxed at the full marginal rate whereas capital gains, and dividends, from Canadian stocks are taxed at about half that level. The difference can really add up over time.
Sign up for our free investing newsletter »
Second, interest rates in the early 1980s were sky high—or at least they approached 20%. The pressure was on to pay off a mortgage quickly in those days. But, over the years, rates have fallen into low-single digit territory. For instance, the yield on 10-year government of Canada bonds has been hovering around 1.5%. The yield decline powered the bond bull market. Problem is, bond investors aren’t likely to see much of a boost from falling rates from this point forward. While they might get a little boost, it seems more likely that rates will stabilize or move higher from here. Unfortunately, a yield increase would result in headwinds for bonds rather than tailwinds. As a result, investors shouldn’t expect too much from a typical bond portfolio. Perhaps returns of a couple of a per cent rather than the historical rate near 9%. They should adjust their plans accordingly.| Name | Price | P/E | Dividend Yield | Total Return |
|---|---|---|---|---|
| Tembec (TMB) | $4.12 | 11.44 | 0.00% | 240.50% |
| Air Canada (AC) | $17.35 | 6.67 | 0.00% | 83.60% |
| Cascades (CAS) | $16.83 | 7.38 | 0.95% | 77.70% |
| Interfor (IFP) | $18.01 | 14.88 | 0.00% | 58.40% |
| West Fraser Timber (WFT) | $59.94 | 12.49 | 0.47% | 54.15% |
| Transcontinental (TCL.A) | $25.79 | 10.37 | 3.10% | 52.26% |
| Canfor (CFP) | $19.25 | 13.37 | 0.00% | 45.94% |
| Norbord (OSB) | $39.40 | 12.34 | 3.05% | 45.11% |
| Celestica (CLS) | $17.99 | 14.78 | 0.00% | 38.49% |
| Chorus Aviation (CHR) | $7.47 | 11.38 | 6.43% | 35.31% |
Price: Closing price per share
P/E: Price to Earnings Ratio
Total Return: The total return generated by the stock over the last year
Dividend Yield: Expected-Annual-Dividend divided by Price, expressed as a percentage
As always, do your own due diligence before buying any stock, including those featured here. Make sure its situation hasn’t changed in some important way, read the latest press releases and regulatory filings and take special care with stocks that trade infrequently. Remember, stocks can be risky. So, be careful out there. (Norm may own shares of some, or all, of the stocks mentioned here.)Share this article Share on Facebook Share on Twitter Share on Linkedin Share on Reddit Share on Email

The first quarter finally broke the pattern of steadily rising markets, but energy stocks soared.

Geopolitics, rising oil prices and ETF inflows are shaping Bitcoin’s outlook. Is now the right time for Canadian investors...

Wealthsimple's direct indexing brings a tax-saving investing strategy to a wider group of investors, but the number likely to...

Find the best GIC rates in Canada. Plus, everything you need to know about how they work.

Which ETFs should you invest in? Which ones best suit your risk tolerance? What about personal ethics? Check out...

In the likelihood of a protracted conflict, these experts think people in or close to retirement need to review...

Look under the hood before buying some popular Canadian sector ETFs. There may be alternatives that better represent the...

Lululemon profits dip, Couche-Tard surges, and Power Corp declines. Here’s what investors need to know about Q4 results...

U.S.-Iran tensions have shaken markets, but experts urge investors to stay disciplined, avoid emotional moves, and use volatility to...

Canadian companies face a turbulent quarter, with Algoma Steel losing big and Transat posting gains amid major corporate moves.