Top neighbourhoods in Calgary’s core and inner suburbs 2018
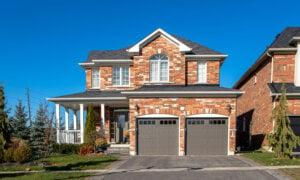
There is value to be found in Calgary's Kingsland neighbourhood
Advertisement
There is value to be found in Calgary's Kingsland neighbourhood
GALLERY: Top 25 Calgary neighbourhoods to buy inBetter still is the ‘hood love. Over and over again this neighbourhood ranks high on various local community-engagement lists and this is only supported by the number of “I Heart Bowness” bumper stickers seen on the roads and highways around the city. A big source of price for this community is Bowness Park, which offers everything from hiking to biking to firepits and BBQs, wading pools, a lagoon and great paddling.
| Rank | Neighbourhood | Area | Average home price (2017) | Value | Momentum | Realtor Grade | Average price vs. area | Avg. price vs. metro district | Avg. price vs. outer region | 1-year price change | 3-year price change | 5-year price change |
|---|---|---|---|---|---|---|---|---|---|---|---|---|
| 1 | Kingsland | Southwest | $522,587 | 77.52 | 76.48 | ★★★½ | 69.72% | N/A | 83.31% | 9.55% | -0.67% | 27.32% |
| 2 | Bowness | Northwest | $510,417 | 65.14 | 85.89 | ★★★ | 87.43% | N/A | 81.37% | 5.25% | 15.10% | 31.71% |
| 3 | Greenview | Northwest | $424,855 | 84.86 | 65.07 | ★★½ | 72.78% | N/A | 67.73% | 9.92% | 6.19% | 17.14% |
| 4 | Highwood | Northwest | $567,709 | 47.71 | 92.62 | ★★★ | 97.25% | N/A | 90.50% | 18.43% | 4.42% | 39.93% |
| 5 | Highland Park | Northwest | $530,707 | 58.72 | 80.41 | ★★★ | 90.91% | N/A | 84.60% | 4.20% | 0.03% | 40.27% |
| 6 | Acadia | Southeast | $456,662 | 67.43 | 65.80 | ★★★ | 87.47% | N/A | 72.80% | 4.66% | 1.24% | 20.99% |
| 7 | Windsor Park | Southwest | $829,886 | 22.94 | 98.16 | ★★★½ | 110.72% | N/A | 132.29% | 25.63% | 14.17% | 56.56% |
| 8 | Silver Springs | Northwest | $549,338 | 55.96 | 67.91 | ★★★½ | 94.10% | N/A | 87.57% | 6.16% | -0.16% | 22.12% |
| 9 | Woodbine | Southwest | $513,018 | 79.82 | 54.28 | ★★★ | 68.45% | N/A | 81.78% | 3.71% | -1.50% | 18.66% |
| 10 | Fairview | Southeast | $432,502 | 75.69 | 57.69 | ★★★ | 82.84% | N/A | 68.94% | 0.83% | 1.29% | 19.43% |
| 11 | Haysboro | Southwest | $489,909 | 82.57 | 48.97 | ★★★ | 65.36% | N/A | 78.10% | -2.70% | -2.77% | 21.43% |
| 12 | Falconridge | Northeast | $316,940 | 84.40 | 58.22 | ★★½ | 85.27% | N/A | 50.52% | -1.17% | -2.00% | 23.19% |
| 13 | Riverbend | Southeast | $446,035 | 71.56 | 59.60 | ★★★ | 85.44% | N/A | 71.10% | 2.42% | -1.22% | 21.15% |
| 14 | Huntington Hills | Northwest | $407,123 | 87.16 | 46.70 | ★★★ | 69.74% | N/A | 64.90% | -0.72% | -4.82% | 21.04% |
| 15 | Deer Run | Southeast | $490,206 | 61.01 | 78.03 | ★★★ | 93.90% | N/A | 78.14% | 5.57% | 10.68% | 23.17% |
| 16 | Castleridge | Northeast | $338,438 | 77.06 | 62.80 | ★★½ | 91.05% | N/A | 53.95% | -2.42% | 1.04% | 24.56% |
| 17 | Lakeview | Southwest | $836,487 | 21.56 | 91.91 | ★★★½ | 111.60% | N/A | 133.34% | 14.45% | 13.35% | 33.84% |
| 18 | Dalhousie | Northwest | $588,714 | 44.04 | 75.51 | ★★★½ | 100.85% | N/A | 93.85% | 8.18% | 1.95% | 22.39% |
| 19 | Queensland | Southeast | $394,681 | 86.24 | 51.08 | ★★½ | 75.60% | N/A | 62.92% | 3.02% | -4.17% | 19.71% |
| 20 | Westgate | Southwest | $585,928 | 63.30 | 52.17 | ★★★½ | 78.17% | N/A | 93.40% | 4.97% | -0.06% | 16.48% |
| 21 | MacEwan Glen | Northwest | $443,956 | 80.28 | 47.53 | ★★★ | 76.05% | N/A | 70.77% | 0.92% | 0.76% | 16.37% |
| 22 | Glamorgan | Southwest | $552,419 | 73.39 | 48.77 | ★★★ | 73.70% | N/A | 88.06% | 3.05% | -4.51% | 18.79% |
| 23 | Southwood | Southwest | $448,555 | 85.78 | 37.88 | ★★★ | 59.84% | N/A | 71.50% | -0.23% | -3.34% | 15.81% |
| 24 | Banff Trail | Northwest | $673,502 | 24.77 | 84.77 | ★★★½ | 115.37% | N/A | 107.36% | 5.81% | 1.75% | 35.39% |
| 25 | Chinook Park | Southwest | $761,356 | 32.11 | 76.65 | ★★★½ | 101.58% | N/A | 121.37% | 10.36% | 4.01% | 21.63% |
Share this article Share on Facebook Share on Twitter Share on Linkedin Share on Reddit Share on Email

Here’s how proposals from the NDP, Liberals, Conservatives and Green Party could affect your cash flow—and maybe help decide...


Created By
Ratehub.ca

The Bank of Canada holds its key rate steady amid the U.S. trade war and economic uncertainty.

Whether you have renters in your home or another property, know that the money you make can affect your...

What to consider when deciding to incorporate a company with friends to buy real estate and more.

Sponsored By
Coast Capital

Can you retroactively change the valuation of a rental property before selling it to reduce capital gains tax in...
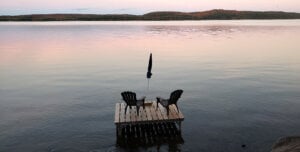
On the heels of a pandemic boom, the recreational real estate market has slowed. But property prices are still...