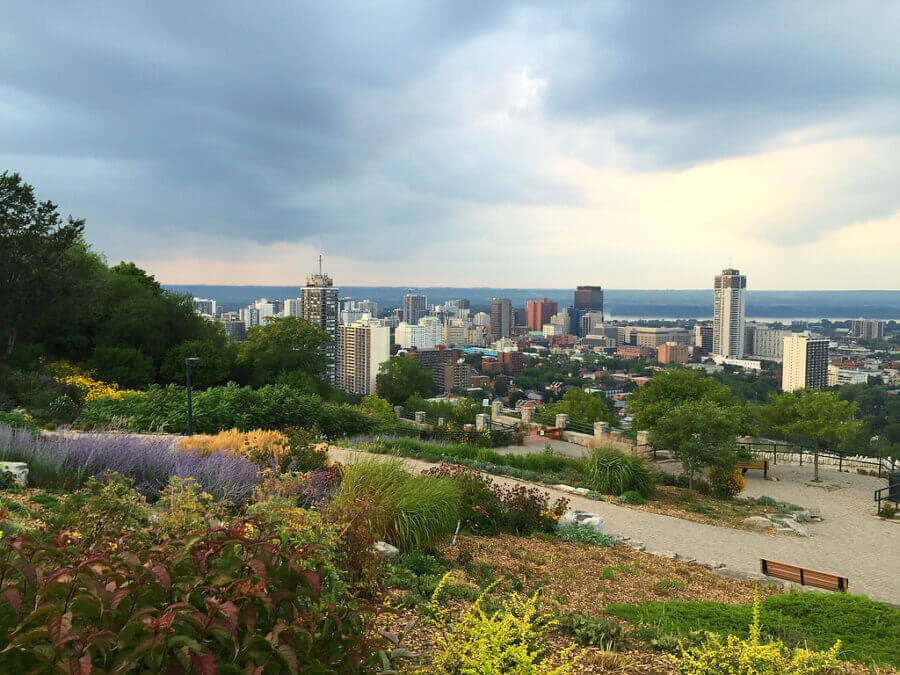
Often overshadowed by Toronto to the east and Niagara Falls to the west, Hamilton is a city primed to explode. While prices have certainly appreciated over the last decade, there are still deals to be found in this city with Steeltown roots. And, in recent years, developers finally gave Hamilton a second look. Now the blue-collar city is experiencing a renaissance. Journalists from across North America consider it a bit of an artists’ hub (the Juno Award-winning band Arkells being a prime example of local talent), while house-hunters see the city as an affordable place to own a single-family home, yet still get to and from work with a manageable commute. Compare mortgage rates on Ratehub.ca* Thing is, there are more than 200 neighbourhoods in the Regional Municipality of Hamilton, a region that includes six local cities: Ancaster, Dundas, Flamborough, Glanbrook, Hamilton and Stoney Creek. In Hamilton alone, there are nearly 100 communities with an average sale price of just under $550,000. So, how can a buyer narrow the options down to a suitable investment? Consider the current value and the possibility of future appreciation. This year, the best area to buy a single-family home is in downtown Hamilton. Yes, we know about this area’s gritty reputation. Rooming houses, squats, low-rent housing, and dilapidated two-stories still dominate, but over the last half-decade, the grit has had to make room for the trendy and artistic—and with this has come gentrification and investment. As a result, there are fewer outdated structures, and more homeowners moving in and renovating the beautiful old homes in this community. Nine of the top 10 Hamilton neighbourhoods in this year’s Where to Buy in Real Estate report are downtown. In part, this reflects the demographics and needs of current home buyers—younger professionals who prioritize walking, biking and transit access above a two-car garage.
Search by neighbourhood or area to filter results.
Rank
Neighbourhood
Area
Average home price (2017)
Value
Momentum
Average price vs. area
Avg. price vs. metro district
Avg. price vs. outer region
1-year price change
5-year price change
Final Star Rating
1
Corktown
14
$328,165
88.01%
61.07%
94.30%
91.20%
67.10%
-5.74%
98.60%
★★★★
2
Stinson
14
$328,165
88.01%
60.72%
94.30%
91.20%
67.10%
-5.74%
98.60%
★★★★
3
Beasley
14
$328,165
88.01%
60.37%
94.30%
91.20%
67.10%
-5.74%
98.60%
★★★★
4
Hamilton Centre (21)
21
$277,875
47.26%
98.63%
115.20%
77.30%
56.90%
15.22%
132.40%
★★★★
5
Crown Point East
20
$336,688
60.62%
85.93%
101.80%
93.60%
68.90%
1.84%
102.20%
★★★★
6
Ottawa Street
20
$336,688
60.62%
86.28%
101.80%
93.60%
68.90%
1.84%
102.20%
★★★★
7
North And East
13
$340,357
47.26%
92.46%
103.20%
94.60%
69.60%
3.21%
104.30%
★★★★
8
Landsdale
14
$328,165
88.01%
60.02%
94.30%
91.20%
67.10%
-5.74%
98.60%
★★★★
9
Gibson/Stipley (south of King St.)
20
$336,688
60.62%
85.23%
101.80%
93.60%
68.90%
1.84%
102.20%
★★★★
10
Crown Point West
20
$336,688
60.62%
85.58%
101.80%
93.60%
68.90%
1.84%
102.20%
★★★★
11
Gibson
20
$336,688
60.62%
84.88%
101.80%
93.60%
68.90%
1.84%
102.20%
★★★½
12
Stipley
20
$336,688
60.62%
84.53%
101.80%
93.60%
68.90%
1.84%
102.20%
★★★½
13
Hamilton General Hospital
13
$340,357
47.26%
92.11%
103.20%
94.60%
69.60%
3.21%
104.30%
★★★½
14
McQuesten West
23
$332,472
44.35%
91.67%
108.80%
89.40%
68.00%
8.79%
96.20%
★★★½
15
Parkview East
23
$332,472
44.35%
92.02%
108.80%
89.40%
68.00%
8.79%
96.20%
★★★½
16
Homeside
23
$332,472
44.35%
92.71%
108.80%
89.40%
68.00%
8.79%
96.20%
★★★½
17
Parkview West
23
$332,472
44.35%
91.32%
108.80%
89.40%
68.00%
8.79%
96.20%
★★★½
18
Normanhurst
23
$332,472
44.35%
92.37%
108.80%
89.40%
68.00%
8.79%
96.20%
★★★½
19
Delta West
22
$462,041
41.44%
75.90%
100.60%
128.50%
94.50%
0.60%
90.40%
★★★½
20
Blakeley
22
$462,041
41.44%
75.55%
100.60%
128.50%
94.50%
0.60%
90.40%
★★★½
21
Hamilton Lower City
28
$389,324
39.55%
81.38%
104.70%
104.70%
79.70%
4.73%
73.60%
★★★½
22
Sherwood
25
$459,357
48.12%
70.82%
102.20%
97.90%
94.00%
2.16%
75.30%
★★★½
23
Inch Park
17
$410,125
47.60%
75.16%
104.90%
87.40%
83.90%
4.93%
71.30%
★★★½
24
Balfour
17
$410,125
47.60%
72.36%
104.90%
87.40%
83.90%
4.93%
71.30%
★★★½
25
St. Claire
22
$462,041
41.44%
75.20%
100.60%
128.50%
94.50%
0.60%
90.40%
★★★½
26
Delta East
22
$462,041
41.44%
74.85%
100.60%
128.50%
94.50%
0.60%
90.40%
★★★½
27
Macassa
17
$410,125
47.60%
73.76%
104.90%
87.40%
83.90%
4.93%
71.30%
★★★½
28
Strathcona
10
$410,820
40.75%
68.21%
108.10%
89.30%
84.10%
8.08%
73.60%
★★★½
29
Burkholme
17
$410,125
47.60%
74.11%
104.90%
87.40%
83.90%
4.93%
71.30%
★★★½
30
Central
10
$410,820
40.75%
67.86%
108.10%
89.30%
84.10%
8.08%
73.60%
★★★½
31
Huntington
25
$459,357
48.12%
70.47%
102.20%
97.90%
94.00%
2.16%
75.30%
★★★½
32
King Street West
10
$410,820
40.75%
68.56%
108.10%
89.30%
84.10%
8.08%
73.60%
★★★½
33
Centremount
17
$410,125
47.60%
72.71%
104.90%
87.40%
83.90%
4.93%
71.30%
★★★½
34
Kentley
27
$407,140
41.78%
82.38%
102.60%
109.50%
83.30%
2.61%
80.00%
★★★½
35
Hamton Heights
25
$459,357
48.12%
69.78%
102.20%
97.90%
94.00%
2.16%
75.30%
★★★½
36
Sunninghill
25
$459,357
48.12%
70.13%
102.20%
97.90%
94.00%
2.16%
75.30%
★★★½
37
Greenford
28
$389,324
39.55%
80.68%
104.70%
104.70%
79.70%
4.73%
73.60%
★★★½
38
Mountain Park
17
$410,125
47.60%
74.81%
104.90%
87.40%
83.90%
4.93%
71.30%
★★★½
39
Hill Park
17
$410,125
47.60%
73.41%
104.90%
87.40%
83.90%
4.93%
71.30%
★★★½
40
Eastmount
17
$410,125
47.60%
74.46%
104.90%
87.40%
83.90%
4.93%
71.30%
★★★½
41
Hannon West
26
$435,641
64.73%
53.68%
99.20%
92.90%
89.10%
-0.79%
70.10%
★★★½
42
Main Street West (103)
10
$410,820
40.75%
67.51%
108.10%
89.30%
84.10%
8.08%
73.60%
★★★½
43
Hannon South
26
$435,641
64.73%
54.03%
99.20%
92.90%
89.10%
-0.79%
70.10%
★★★½
44
Grayside
27
$407,140
41.78%
82.03%
102.60%
109.50%
83.30%
2.61%
80.00%
★★★½
45
Riverdale East
27
$407,140
41.78%
81.33%
102.60%
109.50%
83.30%
2.61%
80.00%
★★★½
46
Raleigh
17
$410,125
47.60%
73.06%
104.90%
87.40%
83.90%
4.93%
71.30%
★★★½
47
Downtown Dundas
41
$579,000
100.00%
5.18%
0.00%
0.00%
0.00%
-100.00%
-100.00%
★★★½
48
North and West
10
$410,820
40.75%
68.91%
108.10%
89.30%
84.10%
8.08%
73.60%
★★★
49
Corman
28
$389,324
39.55%
79.98%
104.70%
104.70%
79.70%
4.73%
73.60%
★★★
50
Rymal
26
$435,641
64.73%
52.98%
99.20%
92.90%
89.10%
-0.79%
70.10%
★★★
51
Albion Falls
26
$435,641
64.73%
54.38%
99.20%
92.90%
89.10%
-0.79%
70.10%
★★★
52
Red Hill
28
$389,324
39.55%
81.03%
104.70%
104.70%
79.70%
4.73%
73.60%
★★★
53
Nashdale
27
$407,140
41.78%
81.68%
102.60%
109.50%
83.30%
2.61%
80.00%
★★★
54
Vincent
28
$389,324
39.55%
79.63%
104.70%
104.70%
79.70%
4.73%
73.60%
★★★
55
Ainsle Wood North
41
$502,000
100.00%
5.18%
0.00%
0.00%
0.00%
-100.00%
-100.00%
★★★
56
Lisgar
26
$435,641
64.73%
51.93%
99.20%
92.90%
89.10%
-0.79%
70.10%
★★★
57
Templemead Park
26
$435,641
64.73%
53.33%
99.20%
92.90%
89.10%
-0.79%
70.10%
★★★
58
Berrisfield
26
$435,641
64.73%
51.58%
99.20%
92.90%
89.10%
-0.79%
70.10%
★★★
59
Quinndale
26
$435,641
64.73%
52.63%
99.20%
92.90%
89.10%
-0.79%
70.10%
★★★
60
Riverdale West
27
$407,140
41.78%
80.98%
102.60%
109.50%
83.30%
2.61%
80.00%
★★★
61
Dundas Driving Park
41
$502,000
100.00%
5.18%
0.00%
0.00%
0.00%
-100.00%
-100.00%
★★★
62
Gershome
28
$389,324
39.55%
80.33%
104.70%
104.70%
79.70%
4.73%
73.60%
★★★
63
Ancaster
42
$750,000
100.00%
5.18%
0.00%
0.00%
0.00%
-100.00%
-100.00%
★★★
64
Southam/Donnington
15
$519,347
50.68%
45.18%
99.10%
110.70%
106.30%
-0.93%
65.50%
★★★
65
Westcliffe East
15
$519,347
50.68%
46.23%
99.10%
110.70%
106.30%
-0.93%
65.50%
★★★
66
Sheldon
16
$484,636
59.42%
35.77%
99.10%
103.30%
99.20%
-0.87%
61.80%
★★★
67
Rosedale
24
$407,626
29.11%
80.26%
108.00%
109.60%
83.40%
8.04%
75.70%
★★★
68
Roston
16
$484,636
59.42%
34.02%
99.10%
103.30%
99.20%
-0.87%
61.80%
★★★
69
Gilbert
16
$484,636
59.42%
33.67%
99.10%
103.30%
99.20%
-0.87%
61.80%
★★★
70
Highland Park Survey
41
$502,000
100.00%
5.18%
0.00%
0.00%
0.00%
-100.00%
-100.00%
★★★
71
Braughton East
26
$435,641
64.73%
50.88%
99.20%
92.90%
89.10%
-0.79%
70.10%
★★★
72
Randall
18
$522,092
32.88%
57.84%
102.30%
111.30%
106.80%
2.33%
63.90%
★★★
73
Trenholme
26
$435,641
64.73%
51.23%
99.20%
92.90%
89.10%
-0.79%
70.10%
★★★
74
Mohawk
15
$519,347
50.68%
45.53%
99.10%
110.70%
106.30%
-0.93%
65.50%
★★★
75
Falkirk East
16
$484,636
59.42%
36.82%
99.10%
103.30%
99.20%
-0.87%
61.80%
★★★
76
Hannon North
26
$435,641
64.73%
52.28%
99.20%
92.90%
89.10%
-0.79%
70.10%
★★★
77
Valley Park/Maplewood Park
50
$538,328
59.59%
37.18%
97.80%
95.00%
110.10%
-2.22%
66.00%
★★★
78
Spring Creek Conservation Area
41
$502,000
100.00%
5.18%
0.00%
0.00%
0.00%
-100.00%
-100.00%
★★★
79
Westcliffe West
15
$519,347
50.68%
45.88%
99.10%
110.70%
106.30%
-0.93%
65.50%
★★★
80
Glenview West
24
$407,626
29.11%
79.91%
108.00%
109.60%
83.40%
8.04%
75.70%
★★★
81
Gurnett
16
$484,636
59.42%
37.17%
99.10%
103.30%
99.20%
-0.87%
61.80%
★★★
82
Jerome
18
$522,092
32.88%
55.75%
102.30%
111.30%
106.80%
2.33%
63.90%
★★★
83
Westdale Village
11
$497,790
62.67%
13.85%
97.60%
108.20%
101.80%
-2.41%
48.90%
★★★
84
Kennedy West
16
$484,636
59.42%
36.12%
99.10%
103.30%
99.20%
-0.87%
61.80%
★★★
85
Kennedy East
16
$484,636
59.42%
35.42%
99.10%
103.30%
99.20%
-0.87%
61.80%
★★★
86
Gilkson
16
$484,636
59.42%
36.47%
99.10%
103.30%
99.20%
-0.87%
61.80%
★★★
87
Westdale North
11
$497,790
62.67%
13.50%
97.60%
108.20%
101.80%
-2.41%
48.90%
★★★
88
Butler
18
$522,092
32.88%
54.70%
102.30%
111.30%
106.80%
2.33%
63.90%
★★★
89
Highbury Dr.
50
$538,328
59.59%
36.83%
97.80%
95.00%
110.10%
-2.22%
66.00%
★★★
90
Headon Forest
35
$691,814
51.03%
31.02%
101.00%
86.50%
141.50%
0.96%
54.10%
★★★
91
Gourley
16
$484,636
59.42%
34.72%
99.10%
103.30%
99.20%
-0.87%
61.80%
★★★
92
Walkers Line
35
$691,814
51.03%
30.32%
101.00%
86.50%
141.50%
0.96%
54.10%
★★★
93
Lawfield
18
$522,092
32.88%
56.10%
102.30%
111.30%
106.80%
2.33%
63.90%
★★★
94
Burlington (31)
31
$735,891
28.94%
48.83%
104.20%
92.00%
150.60%
4.17%
62.20%
★★★
95
Milcroft
35
$691,814
51.03%
31.37%
101.00%
86.50%
141.50%
0.96%
54.10%
★★★
96
Cootes Paradise
11
$497,790
62.67%
13.15%
97.60%
108.20%
101.80%
-2.41%
48.90%
★★★
97
Heritage Green
52
$636,316
43.84%
49.96%
98.30%
112.20%
130.20%
-1.74%
76.90%
★★★
98
Fessenden
16
$484,636
59.42%
34.37%
99.10%
103.30%
99.20%
-0.87%
61.80%
★★★
99
Falkirk West
16
$484,636
59.42%
35.07%
99.10%
103.30%
99.20%
-0.87%
61.80%
★★★
100
Allison
18
$522,092
32.88%
57.15%
102.30%
111.30%
106.80%
2.33%
63.90%
★★★
101
Crerar
18
$522,092
32.88%
56.80%
102.30%
111.30%
106.80%
2.33%
63.90%
★★★
102
Greeningdon
18
$522,092
32.88%
55.05%
102.30%
111.30%
106.80%
2.33%
63.90%
★★★
103
Eleanor
18
$522,092
32.88%
57.49%
102.30%
111.30%
106.80%
2.33%
63.90%
★★★
104
Carpenter
16
$484,636
59.42%
33.32%
99.10%
103.30%
99.20%
-0.87%
61.80%
★★★
105
Thorner
18
$522,092
32.88%
54.00%
102.30%
111.30%
106.80%
2.33%
63.90%
★★★
106
Bruleville
18
$522,092
32.88%
54.35%
102.30%
111.30%
106.80%
2.33%
63.90%
★★★
107
Ryckmans
18
$522,092
32.88%
55.40%
102.30%
111.30%
106.80%
2.33%
63.90%
★★★
108
Ainslie Wood
11
$497,790
62.67%
12.80%
97.60%
108.20%
101.80%
-2.41%
48.90%
★★★
109
Stoney Creek
50
$538,328
59.59%
36.48%
97.80%
95.00%
110.10%
-2.22%
65.90%
★★★
110
Aldershot
30
$721,531
66.95%
6.56%
84.90%
90.20%
147.60%
-15.13%
41.20%
★★★
111
Barnstown
18
$522,092
32.88%
56.45%
102.30%
111.30%
106.80%
2.33%
63.90%
★★½
112
Ainslie Wood East
11
$497,790
62.67%
12.45%
97.60%
108.20%
101.80%
-2.41%
48.90%
★★½
113
Durand (124)
12
$508,583
27.74%
28.35%
103.70%
110.50%
104.10%
3.68%
44.00%
★★½
114
Satellite City (517)
51
$527,913
62.33%
23.00%
97.90%
93.10%
108.00%
-2.13%
61.20%
★★½
115
Sheldon Creek
35
$691,814
51.03%
30.67%
101.00%
86.50%
141.50%
0.96%
54.10%
★★½
116
Chappel East
18
$522,092
32.88%
52.60%
102.30%
111.30%
106.80%
2.33%
63.90%
★★½
117
Chappel West
18
$522,092
32.88%
53.30%
102.30%
111.30%
106.80%
2.33%
63.90%
★★½
118
Havendale
34
$672,011
63.01%
16.94%
98.80%
84.10%
137.50%
-1.23%
53.10%
★★½
119
Satellite City (516)
51
$527,913
62.33%
22.65%
97.90%
93.10%
108.00%
-2.13%
61.20%
★★½
120
Waterdown
46
$656,012
59.93%
12.27%
97.00%
97.00%
134.20%
-3.04%
48.60%
★★½
121
Fruitland
51
$527,913
62.33%
23.70%
97.90%
93.10%
108.00%
-2.13%
61.20%
★★½
122
Tweedside
52
$636,316
43.84%
50.65%
98.30%
112.20%
130.20%
-1.74%
76.90%
★★½
123
Rushdale
18
$522,092
32.88%
53.65%
102.30%
111.30%
106.80%
2.33%
63.90%
★★½
124
Vinemount
52
$636,316
43.84%
50.31%
98.30%
112.20%
130.20%
-1.74%
76.90%
★★½
125
Durand (122)
12
$508,583
27.74%
28.00%
103.70%
110.50%
104.10%
3.68%
44.00%
★★½
126
Broughton West
18
$522,092
32.88%
52.95%
102.30%
111.30%
106.80%
2.33%
63.90%
★★½
127
Community Beach
51
$527,913
62.33%
24.40%
97.90%
93.10%
108.00%
-2.13%
61.20%
★★½
128
Lake Pointe
51
$527,913
62.33%
24.75%
97.90%
93.10%
108.00%
-2.13%
61.20%
★★½
129
Burlington (36)
36
$823,924
39.90%
27.95%
99.90%
103.10%
168.60%
-0.10%
58.70%
★★½
130
Westdale
12
$508,583
27.74%
27.65%
103.70%
110.50%
104.10%
3.68%
44.00%
★★½
131
Winona (514)
51
$527,913
62.33%
24.05%
97.90%
93.10%
108.00%
-2.13%
61.20%
★★½
132
Main Street West (121)
12
$508,583
27.74%
27.31%
103.70%
110.50%
104.10%
3.68%
44.00%
★★½
133
Winona (519)
51
$527,913
62.33%
23.35%
97.90%
93.10%
108.00%
-2.13%
61.20%
★★½
134
Burlington (33)
33
$999,907
39.55%
13.93%
98.50%
125.10%
204.60%
-1.51%
41.80%
★★½
135
Mainway
35
$691,814
51.03%
29.97%
101.00%
86.50%
141.50%
0.96%
54.10%
★★½
136
Hamilton East (29)
29
$571,884
11.47%
49.65%
104.90%
153.80%
117.00%
4.92%
54.00%
★★½
137
Bayview
30
$721,531
66.95%
6.21%
84.90%
90.20%
147.60%
-15.13%
41.20%
★★½
138
Chedoke Park
12
$508,583
27.74%
26.96%
103.70%
110.50%
104.10%
3.68%
44.00%
★★½
139
Binbrook
53
$560,312
23.46%
42.48%
104.00%
104.00%
114.60%
3.96%
61.80%
★★
140
Hamilton East (27)
27
$407,140
41.78%
80.63%
102.60%
109.50%
83.30%
2.61%
80.00%
★★
141
Burlington (38)
38
$1,346,122
44.86%
56.68%
97.10%
168.40%
275.40%
-2.90%
72.10%
★★
142
Burlington (32)
32
$647,802
63.18%
21.96%
99.00%
81.00%
132.50%
-0.97%
59.60%
★½
143
Flamborough (43)
43
$778,256
34.76%
24.08%
102.00%
99.60%
159.20%
1.99%
46.00%
★
Hamilton’s top 3 neighbourhoods to buy
1. Corktown
Want to live in a connected neighbourhood that values diversity, respect and inclusivity? Better still, do you want to live in a neighbourhood that was one of the original four communities comprising city of Hamilton? Corktown may be your answer. Half a decade ago, the neighbourhood was “going through transition.” Now, it could be considered the flagship for what Hamilton can and will be like as it continues to modernize and shed its old image. The community is walking distance from the municipal buildings and offers super-easy access to a commuter GO Station (which takes about 45 minutes to travel into Toronto). Those working in the downtown core can either walk or bike to work—making it ideal for those who don’t want to commute by car. Many of the low-rise and higher-rise rental buildings in the downtown area can be found in Corktown, but that doesn’t mean the area only offers condos and rental suites. Among the high rises, buyers can find stunning examples of Victorian-era residences—the kind of home that helps Hamilton retain its old-world nuance and its ties to early Irish settlers. The good news? The average price of homes in Corktown is about 5% less than in other downtown or central Hamilton neighbourhoods, and about 10% less than the average selling price of Greater Hamilton. Given the surge in property prices in the last decade, it’s not too surprising that this neighbourhood experienced a bit of a price decline over the last year (down about 6%, year-over-year). Still, with strong five-year price growth and excellent value, when compared to surrounding communities, the numbers suggest that Corktown is poised to grow in popularity over the next few years.
2. Stinson
Adjacent to Corktown and slightly to the east of downtown Hamilton is Stinson, the No. 2 neighbourhood in this year’s ranking. Like Corktown, Stinson offers a great collection of Victorian homes (along with a few clapboard tear-downs) that are priced below the area and city averages by about 5% to 10%, respectively. Stinson has excellent access to public transit and commuter train stations, as well as walk and bike options to downtown Hamilton. For those who love being close to nature or scenic hikes, Stinson offers access to the historic Bruce Trail. This part of the trail winds its way up the famous Hamilton Mountain and offers stunning views of the cityscape.
3. Beasley
The community of Beasley is a livable downtown ‘hood where you can eschew the use of a car. The Beasley Neighbourhood Association dedicates volunteer hours and donations to creating and maintaining bike lanes, as well as installing and maintaining basketball hoops and soccer pitches. Efforts are also being made to beautify the neighbourhood alleys—traditionally a dumping ground—and to create and support a community kitchen and garden. Meanwhile, heritage buildings in this community, like the Capitol theatre, are being lovingly restored.
Realistically, however, not all buyers are looking for the urban feel experience of downtown Hamilton. These buyers—and those looking for more commuter-friendly neighbourhoods—should consider looking at houses in Westdale, Dundurn or Kirkendall North. Buyers looking for more established, family-neighbourhoods should look in the communities east of the downtown core, such as Raleigh, Bartonville and Burkholme.
What does the * mean?
Affiliate (monetized) links can sometimes result in a payment to MoneySense (owned by Ratehub Inc.), which helps our website stay free to our users. If a link has an asterisk (*) or is labelled as “Featured,” it is an affiliate link. If a link is labelled as “Sponsored,” it is a paid placement, which may or may not have an affiliate link. Our editorial content will never be influenced by these links. We are committed to looking at all available products in the market. Where a product ranks in our article, and whether or not it’s included in the first place, is never driven by compensation. For more details, read our
MoneySense Monetization policy.