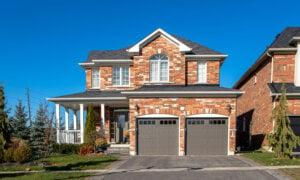
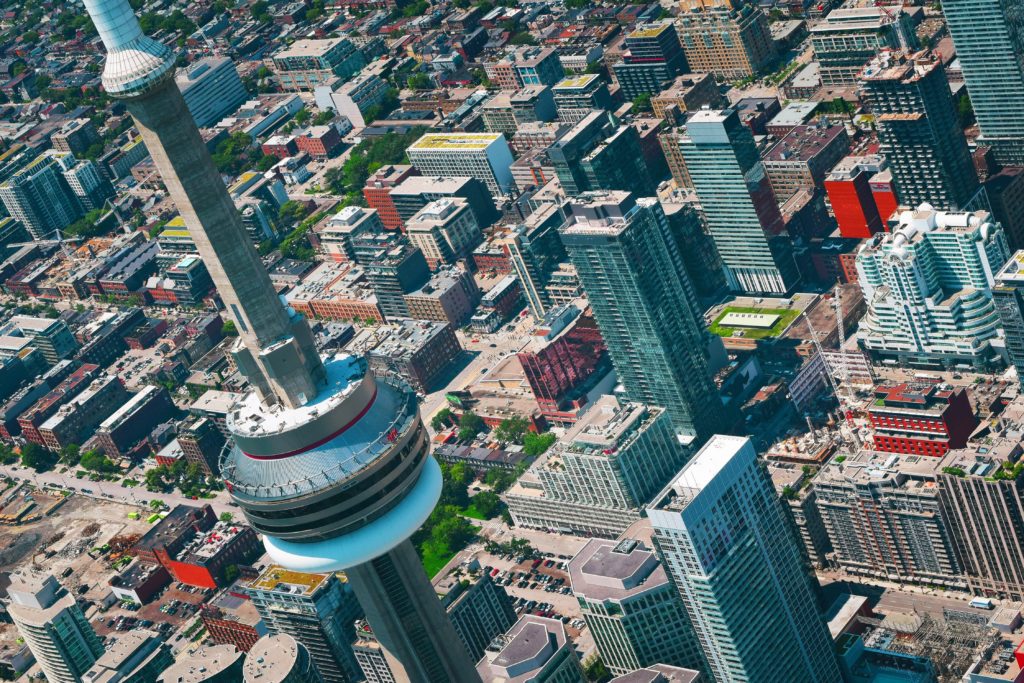
Where to buy real estate in 2019: Greater Toronto Area (GTA)
In the Greater Toronto Area, smaller communities like Angus, Ont., came out on top.
Advertisement
In the Greater Toronto Area, smaller communities like Angus, Ont., came out on top.
| Rank | Neighbourhood | Area | Average home price (2017) | Value | Momentum | Average price vs. area | Avg. price vs. metro district | Avg. price vs. outer region | 1-year price change | 5-year price change | Final Star Rating |
|---|---|---|---|---|---|---|---|---|---|---|---|
| 1 | Angus | Essa | $586,756 | 100.70% | 86.94% | 88.9% | 79.66% | 51.5% | 12.73% | 87.8% | ★★★★½ |
| 2 | Bowmanville | Clarington | $802,567 | 73.95% | 90.34% | 109.3% | 92.49% | 60.8% | 20.86% | 84.3% | ★★★★ |
| 3 | Uptown Core | Oakville | $595,750 | 89.40% | 87.88% | 74.1% | 90.17% | 83.2% | 4.98% | 270.1% | ★★★★ |
| 4 | Concord | Vaughan | $620,373 | 114.70% | 62.41% | 52.7% | 50.91% | 61.8% | -60.24% | 72.7% | ★★★★ |
| 5 | Acton | Halton Hills | $456,692 | 105.50% | 60.77% | 81.7% | 69.70% | 64.3% | 20.50% | 51.5% | ★★★★ |
| 6 | O'Neill | Oshawa | $420,292 | 105.56% | 76.52% | 86.6% | 71.99% | 47.3% | 1.74% | 75.7% | ★★★★ |
| 7 | Cannington | Brock | $568,952 | 109.66% | 70.96% | 82.2% | 66.25% | 43.6% | -1.84% | 101.6% | ★★★★ |
| 8 | Lefroy | Innisfil | $544,707 | 91.98% | 85.42% | 91.9% | 91.27% | 59.0% | 5.04% | 116.4% | ★★★★ |
| 9 | Lisle | Adjala-Tosorontio | $579,917 | 105.74% | 77.99% | 73.4% | 87.39% | 56.5% | -8.38% | 168.7% | ★★★★ |
| 10 | Alliston | New Tecumseth | $376,182 | 80.04% | 83.14% | 102.9% | 93.03% | 60.1% | 19.38% | 71.1% | ★★★★ |
| 11 | Vanier | Oshawa | $750,034 | 115.69% | 65.57% | 71.4% | 59.30% | 39.0% | -10.94% | 74.4% | ★★★★ |
| 12 | Rockcliffe-Smythe | Toronto W03 | $645,521 | 82.96% | 80.39% | 97.7% | 63.03% | 77.7% | 6.71% | 79.0% | ★★★★ |
| 13 | Brampton North | Brampton | $606,598 | 89.40% | 76.64% | 93.9% | 81.90% | 66.9% | 9.04% | 70.2% | ★★★★ |
| 14 | Central Park | Brampton | $630,774 | 99.41% | 81.09% | 88.2% | 76.96% | 62.9% | 7.95% | 75.0% | ★★★★ |
| 15 | Northgate | Brampton | $549,453 | 93.27% | 76.29% | 91.7% | 80.03% | 65.4% | 12.67% | 65.0% | ★★★★ |
| 16 | Sutton & Jackson's Point | Georgina | $598,738 | 103.22% | 66.92% | 91.5% | 46.96% | 57.0% | -5.66% | 90.3% | ★★★★ |
| 17 | Cookstown | Innisfil | $481,341 | 83.61% | 75.88% | 96.7% | 96.05% | 62.1% | -11.87% | 113.6% | ★★★★ |
| 18 | Donevan | Oshawa | $723,575 | 99.65% | 76.11% | 91.3% | 75.87% | 49.9% | 3.62% | 76.0% | ★★★★ |
| 19 | Humber Summit | Toronto W05 | $444,621 | 88.88% | 76.87% | 94.2% | 60.81% | 75.0% | -4.97% | 133.4% | ★★★★ |
| 20 | Stroud | Innisfil | $573,723 | 112.30% | 47.42% | 71.8% | 71.33% | 46.1% | -25.96% | 55.9% | ★★★★ |
| 21 | Pefferlaw | Georgina | $439,984 | 97.42% | 72.07% | 95.5% | 49.03% | 59.5% | -6.62% | 75.0% | ★★★★ |
| 22 | Beaverton | Brock | $627,368 | 106.62% | 51.58% | 86.0% | 69.35% | 45.6% | -8.87% | 56.7% | ★★★★ |
| 23 | Southgate | Brampton | $438,398 | 94.50% | 69.67% | 91.2% | 79.60% | 65.0% | 3.16% | 68.2% | ★★★★ |
| 24 | Lakeview | Oshawa | $655,978 | 108.72% | 69.79% | 83.2% | 69.10% | 45.4% | -29.48% | 85.6% | ★★★★ |
| 25 | Brampton West | Brampton | $916,466 | 86.71% | 70.61% | 95.4% | 83.23% | 68.0% | 9.60% | 63.0% | ★★★★ |
| 26 | Oakwood-Vaughan | Toronto C03 | $511,824 | 90.34% | 69.38% | 51.4% | 77.02% | 95.0% | 7.70% | 71.1% | ★★★★ |
| 27 | McLaughlin | Oshawa | $706,722 | 90.75% | 75.76% | 97.1% | 80.68% | 53.1% | 0.54% | 78.7% | ★★★★ |
| 28 | Glenfield-Jane Heights | Toronto W05 | $1,204,201 | 93.74% | 82.44% | 92.0% | 59.39% | 73.3% | -3.66% | 168.6% | ★★★★ |
| 29 | Little Portugal | Toronto C01 | $474,627 | 58.72% | 86.53% | 89.3% | 101.20% | 124.8% | 1.39% | 186.1% | ★★★★ |
| 30 | Village East | Pickering | $870,416 | 113.06% | 43.74% | 59.4% | 74.81% | 49.2% | -24.03% | 73.0% | ★★★★ |
| 31 | Vaughan Grove | Vaughan | $659,920 | 90.75% | 77.05% | 77.0% | 74.39% | 90.2% | -15.16% | 147.3% | ★★★★ |
| 32 | Avondale | Brampton | $661,419 | 85.77% | 73.42% | 95.9% | 83.73% | 68.4% | 7.63% | 67.3% | ★★★★ |
| 33 | Tottenham | New Tecumseth | $601,386 | 60.77% | 95.08% | 117.3% | 106.11% | 68.6% | 20.88% | 115.3% | ★★★★ |
| 34 | Downtown Whitby | Whitby | $705,702 | 88.47% | 81.09% | 92.9% | 94.79% | 62.3% | 9.33% | 77.1% | ★★★★ |
| 35 | Bay Ridges | Pickering | $701,448 | 83.26% | 70.49% | 88.3% | 111.24% | 73.1% | 2.42% | 79.7% | ★★★★ |
| 36 | Oakridge | Toronto E06 | $692,474 | 99.53% | 64.46% | 86.8% | 58.95% | 72.7% | -4.68% | 74.4% | ★★★★ |
| 37 | Downtown Brampton | Brampton | $687,440 | 78.81% | 78.22% | 100.7% | 87.86% | 71.8% | 12.73% | 67.6% | ★★★★ |
| 38 | Northwood Park | Brampton | $615,053 | 80.50% | 77.93% | 99.9% | 87.22% | 71.3% | 7.24% | 72.6% | ★★★★ |
| 39 | Mount Dennis | Toronto W04 | $646,112 | 112.30% | 54.57% | 68.0% | 51.69% | 63.8% | -1.51% | 61.0% | ★★★★ |
| 40 | Madoc | Brampton | $602,174 | 88.99% | 64.99% | 93.9% | 81.98% | 67.0% | 11.79% | 58.7% | ★★★★ |
| 41 | Everett | Adjala-Tosorontio | $553,431 | 97.48% | 65.28% | 81.2% | 96.60% | 62.4% | 0.78% | 62.6% | ★★★★ |
| 42 | Centennial | Oshawa | $728,256 | 80.91% | 76.64% | 105.0% | 87.24% | 57.4% | 8.80% | 76.4% | ★★★★ |
| 43 | Inglewood | Caledon | $606,155 | 88.47% | 70.78% | 85.9% | 92.40% | 75.5% | -29.63% | 105.3% | ★★★★ |
| 44 | Central | Ajax | $564,930 | 87.59% | 73.59% | 93.3% | 95.55% | 62.8% | 27.29% | 65.7% | ★★★★ |
| 45 | Keswick North | Georgina | $581,441 | 99.12% | 55.74% | 94.1% | 48.28% | 58.6% | -12.60% | 69.8% | ★★★★ |
| 46 | Sunderland | Brock | $644,662 | 70.96% | 80.39% | 113.7% | 91.65% | 60.3% | 0.11% | 90.6% | ★★★★ |
| 47 | Mountainside | Burlington | $682,003 | 105.44% | 55.21% | 78.1% | 72.43% | 66.8% | 3.48% | 58.0% | ★★★★ |
| 48 | Heart Lake West | Brampton | $874,039 | 81.85% | 76.29% | 99.2% | 86.53% | 70.7% | 14.52% | 65.6% | ★★★★ |
| 49 | Woodbine-Lumsden | Toronto E03 | $713,276 | 85.25% | 57.73% | 86.2% | 73.45% | 90.6% | 1.02% | 65.1% | ★★★★ |
| 50 | Fletcher's West | Brampton | $561,365 | 72.37% | 78.22% | 103.7% | 90.50% | 73.9% | 11.56% | 73.6% | ★★★½ |
| 51 | Beeton | New Tecumseth | $683,211 | 85.01% | 71.19% | 99.6% | 90.06% | 58.2% | 2.98% | 69.0% | ★★★½ |
| 52 | Heart Lake East | Brampton | $1,306,366 | 81.56% | 75.82% | 99.3% | 86.68% | 70.8% | 11.48% | 68.4% | ★★★½ |
| 53 | Kensington-Chinatown | Toronto C01 | $630,926 | 45.55% | 92.74% | 96.8% | 109.78% | 135.4% | 9.62% | 473.2% | ★★★½ |
| 54 | Historic Lakeshore Communities | Georgina | $659,140 | 85.60% | 72.95% | 105.1% | 53.92% | 65.4% | -5.38% | 132.6% | ★★★½ |
| 55 | Malton | Mississauga | $731,473 | 102.69% | 58.96% | 71.6% | 83.63% | 68.3% | 1.25% | 61.9% | ★★★½ |
| 56 | Weston | Toronto W04 | $813,832 | 99.88% | 53.98% | 80.9% | 61.47% | 75.8% | 0.80% | 61.9% | ★★★½ |
| 57 | Humberlea-Pelmo Park W4 | Toronto W04 | $886,913 | 86.59% | 70.32% | 90.0% | 68.39% | 84.4% | -5.68% | 91.7% | ★★★½ |
| 58 | Briar Hill-Belgravia | Toronto W04 | $730,270 | 71.84% | 76.35% | 98.1% | 74.53% | 91.9% | -0.42% | 83.1% | ★★★½ |
| 59 | West Hill | Toronto E10 | $1,353,253 | 95.02% | 54.10% | 88.3% | 61.37% | 75.7% | 8.42% | 57.2% | ★★★½ |
| 60 | Dufferin Grove | Toronto C01 | $611,338 | 40.05% | 95.84% | 100.3% | 113.72% | 140.3% | 14.72% | 512.7% | ★★★½ |
| 61 | Gore Industrial North | Brampton | $702,736 | 98.19% | 56.26% | 88.9% | 77.57% | 63.4% | -22.63% | 62.5% | ★★★½ |
| 62 | Humbermede | Toronto W05 | $745,701 | 94.67% | 59.37% | 91.5% | 59.06% | 72.8% | -1.87% | 82.7% | ★★★½ |
| 63 | Keelesdale-Eglinton West | Toronto W03 | $960,544 | 84.13% | 74.06% | 97.1% | 62.67% | 77.3% | 7.14% | 71.8% | ★★★½ |
| 64 | Cornell | Markham | $731,688 | 82.61% | 69.15% | 72.8% | 82.09% | 99.6% | 5.64% | 111.7% | ★★★½ |
| 65 | Central Newmarket | Newmarket | $690,014 | 96.19% | 46.84% | 86.1% | 62.53% | 75.8% | -12.62% | 61.8% | ★★★½ |
| 66 | Blue Grass Meadows | Whitby | $772,315 | 67.27% | 79.98% | 106.6% | 108.76% | 71.5% | 12.90% | 72.1% | ★★★½ |
| 67 | Eglinton East | Toronto E08 | $729,499 | 94.85% | 55.74% | 84.3% | 64.90% | 80.1% | 0.24% | 65.6% | ★★★½ |
| 68 | Rexdale-Kipling | Toronto W10 | $818,958 | 78.98% | 69.85% | 103.9% | 61.31% | 75.6% | 2.91% | 69.4% | ★★★½ |
| 69 | Caledon Village | Caledon | $555,318 | 68.09% | 72.95% | 96.6% | 103.91% | 84.9% | -12.80% | 86.0% | ★★★½ |
| 70 | Keswick South | Georgina | $582,162 | 101.87% | 43.38% | 92.5% | 47.46% | 57.6% | -2.51% | 53.0% | ★★★½ |
| 71 | Eastdale | Oshawa | $1,023,389 | 73.48% | 81.09% | 110.4% | 91.76% | 60.3% | 15.76% | 69.4% | ★★★½ |
| 72 | Maple | Vaughan | $758,145 | 67.86% | 77.05% | 90.6% | 87.46% | 106.1% | 13.71% | 108.1% | ★★★½ |
| 73 | Northwest Sandalwood Parkway | Brampton | $730,011 | 61.07% | 73.54% | 110.2% | 96.19% | 78.6% | 15.34% | 63.1% | ★★★½ |
| 74 | Crescent Town | Toronto E03 | $864,733 | 103.04% | 38.17% | 72.0% | 61.35% | 75.7% | -4.26% | 52.4% | ★★★½ |
| 75 | Caledonia-Fairbank | Toronto W03 | $867,882 | 61.18% | 85.48% | 112.6% | 72.67% | 89.6% | 9.95% | 85.6% | ★★★½ |
| 76 | Northwest Brampton | Brampton | $780,121 | 42.51% | 90.40% | 126.2% | 110.12% | 90.0% | 19.07% | 88.5% | ★★★½ |
| 77 | Liverpool | Pickering | $1,306,424 | 64.58% | 71.84% | 97.6% | 122.97% | 80.9% | 15.03% | 67.8% | ★★★½ |
| 78 | Cabbagetown-South St. James Town | Toronto C08 | $787,418 | 39.52% | 81.85% | 103.1% | 109.79% | 135.4% | -4.84% | 240.8% | ★★★½ |
| 79 | Meadowvale | Mississauga | $695,434 | 81.73% | 55.04% | 85.6% | 99.91% | 81.6% | 6.81% | 56.5% | ★★★½ |
| 80 | Brampton South | Brampton | $635,224 | 77.58% | 61.07% | 101.1% | 88.24% | 72.1% | 4.43% | 61.1% | ★★★½ |
| 81 | Rural Scugog | Scugog | $589,178 | 80.39% | 69.85% | 97.2% | 100.13% | 65.8% | -1.11% | 72.0% | ★★★½ |
| 82 | Pinecrest | Oshawa | $783,831 | 71.55% | 66.69% | 111.8% | 92.87% | 61.1% | 11.11% | 62.9% | ★★★½ |
| 83 | Mt Albert | East Gwillimbury | $749,340 | 91.16% | 72.54% | 86.7% | 66.99% | 81.2% | 8.15% | 69.2% | ★★★½ |
| 84 | Huron Heights-Leslie Valley | Newmarket | $715,312 | 93.56% | 45.20% | 88.1% | 64.04% | 77.7% | 4.05% | 55.0% | ★★★½ |
| 85 | Bronte Meadows | Milton | $729,035 | 90.34% | 43.38% | 89.6% | 80.37% | 74.1% | -2.54% | 50.1% | ★★★½ |
| 86 | Woburn | Toronto E09 | $775,982 | 83.49% | 59.48% | 99.9% | 61.27% | 75.6% | 2.84% | 65.9% | ★★★½ |
| 87 | Taunton North | Whitby | $753,126 | 47.48% | 75.94% | 119.8% | 122.32% | 80.4% | 15.91% | 68.2% | ★★★½ |
| 88 | Fletcher's Meadow | Brampton | $689,858 | 62.35% | 74.88% | 109.5% | 95.56% | 78.1% | 13.94% | 65.9% | ★★★½ |
| 89 | Port Perry | Scugog | $833,210 | 68.62% | 62.12% | 105.5% | 108.74% | 71.5% | 7.38% | 61.3% | ★★★½ |
| 90 | Appleby | Burlington | $852,992 | 65.75% | 62.82% | 101.0% | 93.62% | 86.4% | 18.65% | 59.4% | ★★★½ |
| 91 | Bolton North | Caledon | $594,227 | 61.53% | 70.78% | 100.6% | 108.23% | 88.4% | 14.61% | 61.0% | ★★★½ |
| 92 | Samac | Oshawa | $746,787 | 70.49% | 79.51% | 112.7% | 93.67% | 61.6% | 17.30% | 71.2% | ★★★½ |
| 93 | Mount Olive-Silverstone-Jamestown | Toronto W10 | $783,609 | 75.29% | 77.28% | 106.3% | 62.76% | 77.4% | 8.63% | 74.0% | ★★★½ |
| 94 | Fletcher's Creek Village | Brampton | $915,568 | 55.15% | 77.46% | 113.9% | 99.42% | 81.2% | 17.41% | 66.4% | ★★★½ |
| 95 | Etobicoke West Mall | Toronto W08 | $966,748 | 88.82% | 45.37% | 69.4% | 76.94% | 94.9% | -3.81% | 55.5% | ★★★½ |
| 96 | Mimico | Toronto W06 | $774,240 | 60.54% | 73.42% | 102.4% | 81.24% | 100.2% | 4.87% | 77.3% | ★★★½ |
| 97 | Duffin Heights | Pickering | $692,097 | 66.10% | 60.01% | 96.9% | 122.04% | 80.3% | 7.73% | 60.3% | ★★★½ |
| 98 | Kennedy Park | Toronto E04 | $671,247 | 96.14% | 38.52% | 91.5% | 58.16% | 71.7% | -1.65% | 56.0% | ★★★½ |
| 99 | South West | Ajax | $712,802 | 71.72% | 66.80% | 103.3% | 105.81% | 69.6% | 12.17% | 61.6% | ★★★½ |
| 100 | Black Creek | Toronto W05 | $640,247 | 92.51% | 64.70% | 92.8% | 59.90% | 73.9% | 4.55% | 59.1% | ★★★½ |
| 101 | Gilford | Innisfil | $781,828 | 73.65% | 68.27% | 103.4% | 102.71% | 66.4% | -17.28% | 74.9% | ★★★½ |
| 102 | Brock Ridge | Pickering | $691,427 | 63.93% | 72.54% | 97.8% | 123.24% | 81.0% | 11.04% | 70.2% | ★★★½ |
| 103 | Lynde Creek | Whitby | $912,853 | 66.86% | 67.15% | 106.8% | 108.99% | 71.7% | 11.21% | 61.6% | ★★★½ |
| 104 | Bayview Wellington | Aurora | $1,008,107 | 85.54% | 50.94% | 79.9% | 78.01% | 94.6% | 4.86% | 59.4% | ★★★½ |
| 105 | Sherwood-Amberglen | Markham | $829,358 | 78.57% | 56.79% | 76.4% | 86.15% | 104.5% | -6.57% | 92.2% | ★★★½ |
| 106 | Bolton East | Caledon | $538,162 | 65.52% | 61.94% | 97.8% | 105.23% | 86.0% | 16.50% | 57.5% | ★★★½ |
| 107 | Newcastle | Clarington | $931,544 | 86.77% | 42.21% | 100.2% | 84.83% | 55.8% | 1.10% | 54.7% | ★★★½ |
| 108 | Glen Shields | Vaughan | $767,328 | 82.49% | 61.36% | 82.4% | 79.61% | 96.6% | 1.10% | 64.0% | ★★★½ |
| 109 | Uxbridge | Uxbridge | $693,012 | 68.79% | 58.78% | 95.0% | 120.95% | 79.5% | 11.31% | 56.4% | ★★★½ |
| 110 | Palmer | Burlington | $695,829 | 98.42% | 49.06% | 84.0% | 77.87% | 71.8% | 0.90% | 58.5% | ★★★½ |
| 111 | Rural Brock | Brock | $768,813 | 51.87% | 97.13% | 136.0% | 109.68% | 72.1% | 25.54% | 123.4% | ★★★½ |
| 112 | West Humber-Clairville | Toronto W10 | $742,644 | 70.78% | 75.94% | 109.5% | 64.61% | 79.7% | 10.61% | 67.4% | ★★★½ |
| 113 | Elms-Old Rexdale | Toronto W10 | $707,335 | 76.46% | 69.79% | 105.8% | 62.41% | 77.0% | 8.70% | 65.2% | ★★★½ |
| 114 | Pringle Creek | Whitby | $1,098,825 | 61.94% | 72.95% | 109.2% | 111.49% | 73.3% | 15.67% | 67.4% | ★★★½ |
| 115 | East York | Toronto E03 | $787,442 | 45.67% | 76.58% | 108.3% | 92.34% | 113.9% | 10.23% | 76.6% | ★★★½ |
| 116 | Clairlea-Birchmount | Toronto E04 | $980,000 | 73.30% | 60.30% | 104.1% | 66.17% | 81.6% | 2.71% | 66.8% | ★★★½ |
| 117 | Vellore Village | Vaughan | $792,368 | 74.47% | 53.69% | 86.7% | 83.75% | 101.6% | -2.22% | 75.6% | ★★★½ |
| 118 | Bolton West | Caledon | $725,118 | 73.54% | 51.00% | 93.5% | 100.53% | 82.1% | 14.93% | 52.8% | ★★★½ |
| 119 | Westgate | Brampton | $1,279,511 | 69.32% | 65.28% | 105.4% | 92.00% | 75.2% | 8.12% | 61.9% | ★★★½ |
| 120 | Moss Park | Toronto C08 | $1,195,876 | 43.62% | 80.04% | 101.0% | 107.53% | 132.6% | 17.07% | 433.1% | ★★★½ |
| 121 | Wismer | Markham | $508,132 | 57.20% | 75.41% | 90.7% | 102.20% | 124.0% | 15.36% | 116.6% | ★★★½ |
| 122 | Orono | Clarington | $968,126 | 93.21% | 50.88% | 94.6% | 80.10% | 52.7% | 1.49% | 55.3% | ★★★½ |
| 123 | Danforth Village-East York | Toronto E03 | $338,958 | 66.92% | 48.65% | 95.5% | 81.36% | 100.4% | 2.18% | 60.8% | ★★★½ |
| 124 | Village Green-South Unionville | Markham | $888,036 | 119.96% | 3.16% | 25.7% | 28.97% | 35.1% | -68.41% | -59.9% | ★★★½ |
| 125 | Old Markham Village | Markham | $711,065 | 91.39% | 33.26% | 67.3% | 75.89% | 92.0% | -28.54% | 37.7% | ★★★½ |
| 126 | Port Whitby | Whitby | $701,330 | 61.07% | 63.29% | 109.8% | 112.08% | 73.7% | 12.79% | 60.1% | ★★★½ |
| 127 | Heart Lake | Brampton | $901,770 | 76.29% | 72.31% | 102.0% | 88.98% | 72.7% | 10.35% | 71.8% | ★★★½ |
| 128 | Aurora Heights | Aurora | $715,237 | 87.24% | 48.71% | 79.0% | 77.07% | 93.5% | -9.13% | 64.2% | ★★★½ |
| 129 | Old Milton | Milton | $721,842 | 90.63% | 36.07% | 89.6% | 80.36% | 74.1% | -9.59% | 55.8% | ★★★½ |
| 130 | Dorset Park | Milton | $805,275 | 88.70% | 46.14% | 90.4% | 81.10% | 74.8% | -2.03% | 53.2% | ★★★½ |
| 131 | Georgetown | Halton Hills | $763,999 | 63.88% | 53.86% | 106.1% | 90.48% | 83.5% | 20.15% | 51.2% | ★★★½ |
| 132 | Bristol-London | Newmarket | $874,229 | 90.34% | 45.49% | 89.9% | 65.29% | 79.2% | 4.97% | 54.0% | ★★★½ |
| 133 | Beechborough-Greenbrook | Toronto W04 | $289,719 | 74.12% | 69.32% | 96.7% | 73.47% | 90.6% | -19.28% | 117.4% | ★★★½ |
| 134 | West Woodbridge | Vaughan | $1,596,098 | 120.49% | 3.57% | 25.6% | 24.76% | 30.0% | -66.69% | -55.7% | ★★★½ |
| 135 | Englemount-Lawrence | Toronto C04 | $794,446 | 50.47% | 70.49% | 80.1% | 134.13% | 165.4% | -0.82% | 79.1% | ★★★½ |
| 136 | Gorham-College Manor | Newmarket | $673,083 | 83.37% | 44.73% | 93.5% | 67.89% | 82.3% | 1.55% | 54.8% | ★★★½ |
| 137 | Armitage | Newmarket | $664,898 | 106.50% | 14.99% | 79.2% | 57.52% | 69.8% | -31.46% | 15.7% | ★★★½ |
| 138 | South East | Ajax | $822,835 | 73.36% | 59.31% | 102.3% | 104.81% | 68.9% | 6.72% | 61.8% | ★★★½ |
| 139 | Sandringham-Wellington | Brampton | $720,971 | 49.30% | 69.26% | 119.6% | 104.40% | 85.3% | 18.33% | 60.2% | ★★★½ |
| 140 | West Shore | Pickering | $700,413 | 79.57% | 50.18% | 90.2% | 113.64% | 74.7% | -9.40% | 59.4% | ★★★½ |
| 141 | Bayview | Burlington | $1,391,603 | 96.55% | 55.80% | 84.9% | 78.70% | 72.6% | -32.53% | 434.4% | ★★★½ |
| 142 | South Parkdale | Toronto W01 | $828,995 | 34.54% | 93.27% | 104.3% | 116.95% | 144.2% | 13.42% | 228.3% | ★★★½ |
| 143 | Dempsey | Milton | $755,808 | 63.47% | 63.41% | 103.9% | 93.14% | 85.9% | 17.89% | 58.7% | ★★★½ |
| 144 | Brant Hills | Burlington | $1,282,144 | 83.20% | 52.75% | 91.6% | 84.92% | 78.3% | 14.48% | 53.2% | ★★★½ |
| 145 | Bathurst Manor | Toronto C06 | $575,977 | 57.26% | 60.42% | 87.9% | 107.75% | 132.9% | -8.66% | 68.8% | ★★★½ |
| 146 | Blackstock | Scugog | $1,079,673 | 96.31% | 39.05% | 88.1% | 90.79% | 59.7% | -15.22% | 45.8% | ★★★½ |
| 147 | West Oak Trails | Oakville | $873,114 | 47.13% | 83.61% | 99.6% | 121.31% | 111.9% | 20.13% | 106.0% | ★★★½ |
| 148 | Blake-Jones | Toronto E01 | $889,193 | 90.63% | 29.33% | 77.9% | 73.37% | 90.5% | -14.16% | 28.8% | ★★★½ |
| 149 | New Toronto | Toronto W06 | $940,929 | 75.18% | 57.14% | 94.2% | 74.73% | 92.2% | -6.33% | 62.8% | ★★★½ |
| 150 | Eringate-Centennial-West Deane | Toronto W08 | $913,862 | 85.77% | 42.68% | 71.3% | 79.07% | 97.5% | 6.91% | 49.2% | ★★★½ |
| 151 | Rouge E10 | Toronto E10 | $875,511 | 58.67% | 58.02% | 110.5% | 76.80% | 94.7% | 2.79% | 63.8% | ★★★½ |
| 152 | Greenwood-Coxwell | Toronto E01 | $914,235 | 89.52% | 27.22% | 78.1% | 73.58% | 90.8% | -3.98% | 47.9% | ★★★½ |
| 153 | Stouffville | Whitchurch-Stouffville | $701,550 | 82.20% | 36.01% | 85.5% | 78.13% | 94.8% | 8.99% | 39.1% | ★★★½ |
| 154 | Brampton East | Brampton | $859,984 | 75.88% | 48.13% | 102.0% | 89.01% | 72.7% | 8.56% | 45.2% | ★★★½ |
| 155 | Beaty | Milton | $405,531 | 56.62% | 63.29% | 107.7% | 96.63% | 89.1% | 18.43% | 56.6% | ★★★½ |
| 156 | Virginia | Georgina | $761,549 | 117.33% | 20.43% | 67.5% | 34.66% | 42.0% | -15.08% | 34.0% | ★★★½ |
| 157 | Fletcher's Creek South | Brampton | $889,142 | 60.07% | 72.95% | 110.7% | 96.62% | 78.9% | 10.29% | 64.3% | ★★★½ |
| 158 | Lakeview Estates | Vaughan | $887,395 | 88.29% | 35.89% | 78.7% | 75.99% | 92.2% | -9.09% | 29.5% | ★★★½ |
| 159 | Lisgar | Mississauga | $837,699 | 61.77% | 59.78% | 96.5% | 112.59% | 92.0% | 18.09% | 56.2% | ★★★½ |
| 160 | Clarke | Milton | $1,507,003 | 61.24% | 63.17% | 104.9% | 94.12% | 86.8% | 13.39% | 58.6% | ★★★½ |
| 161 | Palmerston-Little Italy | Toronto C01 | $1,300,000 | 24.00% | 82.49% | 111.7% | 126.65% | 156.2% | -1.47% | 131.5% | ★★★½ |
| 162 | Vinegar Hill | Markham | $839,000 | 125.00% | 1.87% | 0.0% | 0.00% | 0.0% | -100.00% | -100.0% | ★★★½ |
| 163 | Cedarwood | Markham | $971,303 | 125.00% | 1.87% | 0.0% | 0.00% | 0.0% | -100.00% | -100.0% | ★★★½ |
| 164 | Alderwood | Toronto W06 | $721,620 | 59.48% | 66.80% | 102.9% | 81.63% | 100.7% | 6.30% | 65.1% | ★★★½ |
| 165 | Weston-Pellam Park | Toronto W03 | $631,198 | 89.99% | 44.44% | 94.0% | 60.64% | 74.8% | -2.11% | 59.3% | ★★★½ |
| 166 | Malvern | Toronto E11 | $205,375 | 98.54% | 50.64% | 92.3% | 53.04% | 65.4% | -0.33% | 61.4% | ★★★½ |
| 167 | Bramalea North Industrial | Brampton | $975,044 | 120.73% | 4.04% | 29.9% | 26.06% | 21.3% | -74.15% | -47.0% | ★★★½ |
| 168 | O'Connor-Parkview | Toronto E03 | $652,458 | 65.46% | 53.92% | 96.1% | 81.94% | 101.1% | 5.69% | 60.5% | ★★★½ |
| 169 | Baldwin | Georgina | $699,817 | 81.50% | 52.99% | 108.7% | 55.76% | 67.6% | 1.10% | 50.2% | ★★★½ |
| 170 | Windfields | Oshawa | $713,017 | 51.93% | 78.57% | 132.8% | 110.31% | 72.5% | 7.32% | 79.7% | ★★★½ |
| 171 | Taunton | Oshawa | $692,056 | 49.30% | 71.19% | 135.3% | 112.39% | 73.9% | 12.10% | 68.1% | ★★★½ |
| 172 | Central West | Ajax | $745,776 | 67.04% | 55.09% | 106.5% | 109.09% | 71.7% | 4.28% | 62.2% | ★★★½ |
| 173 | Timberlea | Milton | $756,671 | 82.38% | 38.17% | 93.4% | 83.79% | 77.3% | 5.32% | 41.8% | ★★★½ |
| 174 | Central East | Ajax | $1,009,615 | 51.29% | 72.66% | 116.5% | 119.27% | 78.4% | 15.52% | 66.4% | ★★★½ |
| 175 | Schomberg | King | $272,925 | 80.50% | 42.33% | 66.2% | 86.28% | 104.7% | -1.83% | 43.8% | ★★★½ |
| 176 | Legacy | Markham | $1,007,065 | 121.37% | 3.16% | 20.7% | 23.32% | 28.3% | -78.02% | -59.4% | ★★★½ |
| 177 | Markham Village | Markham | $156,563 | 78.86% | 37.18% | 76.3% | 86.07% | 104.4% | -6.78% | 56.5% | ★★★½ |
| 178 | Churchill | Innisfil | $772,543 | 121.49% | 4.10% | 25.3% | 25.12% | 16.2% | -77.33% | -27.5% | ★★★½ |
| 179 | Brooklin | Whitby | $1,081,496 | 48.30% | 60.48% | 119.3% | 121.77% | 80.1% | 11.90% | 61.7% | ★★★½ |
| 180 | Raymerville | Markham | $623,330 | 70.14% | 54.10% | 82.0% | 92.43% | 112.1% | 0.86% | 64.3% | ★★★½ |
| 181 | Courtice | Clarington | $835,348 | 65.05% | 76.35% | 116.1% | 98.25% | 64.6% | 17.57% | 67.0% | ★★★½ |
| 182 | Harrison | Milton | $730,000 | 61.65% | 55.44% | 104.6% | 93.86% | 86.6% | 16.02% | 53.2% | ★★★½ |
| 183 | Rouge River Estates | Markham | $215,000 | 125.00% | 1.87% | 0.0% | 0.00% | 0.0% | -100.00% | -100.0% | ★★★½ |
| 184 | Rouge Park | Pickering | $246,465 | 120.55% | 4.68% | 26.9% | 33.89% | 22.3% | -77.82% | -38.4% | ★★★½ |
| 185 | Elder Mills | Vaughan | $778,635 | 121.31% | 3.22% | 21.8% | 21.06% | 25.5% | -75.25% | -62.8% | ★★★½ |
| 186 | Thistletown-Beaumonde Heights | Toronto W10 | $829,000 | 68.27% | 62.06% | 110.9% | 65.43% | 80.7% | 6.69% | 65.9% | ★★★½ |
| 187 | Limehouse | Halton Hills | $769,374 | 125.00% | 1.87% | 0.0% | 0.00% | 0.0% | -100.00% | -100.0% | ★★★ |
| 188 | Amberlea | Pickering | $984,244 | 67.45% | 48.07% | 96.3% | 121.27% | 79.7% | 3.64% | 55.6% | ★★★ |
| 189 | Birchcliffe-Cliffside | Toronto E06 | $933,915 | 44.67% | 74.94% | 121.8% | 82.71% | 102.0% | 16.60% | 66.4% | ★★★ |
| 190 | Rustic | Toronto W04 | $606,455 | 63.11% | 68.38% | 103.3% | 78.48% | 96.8% | 0.64% | 102.7% | ★★★ |
| 191 | Northglen | Oshawa | $680,000 | 66.80% | 57.79% | 115.0% | 95.59% | 62.9% | -6.37% | 64.0% | ★★★ |
| 192 | Rosemont | Adjala-Tosorontio | $756,459 | 125.00% | 1.87% | 0.0% | 0.00% | 0.0% | -100.00% | -100.0% | ★★★ |
| 193 | Williamsburg | Whitby | $1,150,535 | 51.23% | 72.66% | 116.8% | 119.24% | 78.4% | 16.45% | 71.0% | ★★★ |
| 194 | Regent Park | Toronto C08 | $744,769 | 59.13% | 47.37% | 90.8% | 96.69% | 119.3% | -2.84% | 58.7% | ★★★ |
| 195 | Bendale | Toronto E09 | $865,025 | 79.74% | 43.56% | 102.0% | 62.59% | 77.2% | 3.32% | 56.2% | ★★★ |
| 196 | Snelgrove | Brampton | $1,176,967 | 43.15% | 68.33% | 125.8% | 109.75% | 89.7% | 8.44% | 62.8% | ★★★ |
| 197 | Cooksville | Mississauga | $315,917 | 21.14% | 85.01% | 127.9% | 149.33% | 122.0% | 24.25% | 73.9% | ★★★ |
| 198 | Trafalgar | Milton | $936,804 | 119.26% | 5.09% | 39.6% | 35.50% | 32.7% | -75.65% | -21.1% | ★★★ |
| 199 | Woodbine Corridor | Toronto E02 | $865,553 | 80.44% | 30.39% | 85.6% | 78.73% | 97.1% | -3.61% | 48.2% | ★★★ |
| 200 | Creditview | Mississauga | $1,616,335 | 66.28% | 43.85% | 94.1% | 109.82% | 89.7% | -2.20% | 49.4% | ★★★ |
| 201 | University | Toronto C01 | $1,100,000 | 16.92% | 88.23% | 119.8% | 135.83% | 167.5% | 3.24% | 495.3% | ★★★ |
| 202 | Rural Markham | Markham | $243,958 | 125.00% | 1.87% | 0.0% | 0.00% | 0.0% | -100.00% | -100.0% | ★★★ |
| 203 | Aurora Grove | Aurora | $1,115,063 | 121.60% | 3.75% | 21.4% | 20.85% | 25.3% | -73.63% | -44.9% | ★★★ |
| 204 | German Mills | Markham | $1,161,163 | 66.45% | 49.77% | 84.5% | 95.30% | 115.6% | -10.10% | 64.5% | ★★★ |
| 205 | Box Grove | Markham | $149,666 | 61.42% | 56.79% | 88.0% | 99.23% | 120.4% | 12.07% | 58.0% | ★★★ |
| 206 | Cheltenham | Caledon | $742,061 | 122.48% | 2.17% | 17.7% | 18.99% | 15.5% | -87.09% | -77.0% | ★★★ |
| 207 | Holland Landing | East Gwillimbury | $668,284 | 98.24% | 29.74% | 82.1% | 63.42% | 76.9% | -16.88% | 51.4% | ★★★ |
| 208 | Mississauga Valleys | Mississauga | $1,032,759 | 101.58% | 8.72% | 72.6% | 84.79% | 69.3% | -17.39% | 6.9% | ★★★ |
| 209 | Aurora Highlands | Aurora | $1,005,905 | 67.45% | 51.41% | 90.4% | 88.26% | 107.1% | 14.53% | 54.9% | ★★★ |
| 210 | Cliffcrest | Toronto E08 | $700,204 | 50.82% | 67.39% | 109.8% | 84.53% | 104.3% | 7.68% | 71.5% | ★★★ |
| 211 | Ionview | Toronto E04 | $1,322,692 | 94.20% | 26.17% | 92.6% | 58.84% | 72.6% | -5.38% | 46.2% | ★★★ |
| 212 | Islington-City Centre West | Toronto W08 | $1,575,584 | 41.51% | 65.98% | 100.3% | 111.16% | 137.1% | 14.44% | 61.2% | ★★★ |
| 213 | Humewood-Cedarvale | Toronto C03 | $277,005 | 45.43% | 60.42% | 88.3% | 132.41% | 163.3% | 10.49% | 60.5% | ★★★ |
| 214 | Woodlands | Pickering | $1,480,988 | 119.67% | 4.04% | 34.7% | 43.66% | 28.7% | -68.63% | -50.2% | ★★★ |
| 215 | Trinity-Bellwoods | Toronto C01 | $1,251,155 | 26.35% | 71.08% | 109.8% | 124.46% | 153.5% | 3.86% | 298.9% | ★★★ |
| 216 | Oak Ridges | Richmond Hill | $723,866 | 51.41% | 60.71% | 93.5% | 106.93% | 129.7% | 20.67% | 56.7% | ★★★ |
| 217 | Bradford | Bradford West Gwillimbury | $918,131 | 66.04% | 58.84% | 102.1% | 116.13% | 75.0% | 11.32% | 60.3% | ★★★ |
| 218 | East End-Danforth | Toronto E02 | $905,284 | 83.43% | 19.73% | 83.9% | 77.16% | 95.2% | -4.79% | 34.3% | ★★★ |
| 219 | Woodland Hill | Newmarket | $995,297 | 62.53% | 50.29% | 106.5% | 77.37% | 93.8% | 7.09% | 57.5% | ★★★ |
| 220 | Vales of Castlemore | Brampton | $834,586 | 26.76% | 70.67% | 144.7% | 126.28% | 103.2% | 18.93% | 63.7% | ★★★ |
| 221 | Coates | Milton | $590,000 | 61.94% | 43.79% | 104.6% | 93.77% | 86.5% | 15.52% | 47.6% | ★★★ |
| 222 | Belhaven | Georgina | $1,015,969 | 125.00% | 1.87% | 0.0% | 0.00% | 0.0% | -100.00% | -100.0% | ★★★ |
| 223 | Greensborough | Markham | $3,378,544 | 77.75% | 34.89% | 77.0% | 86.83% | 105.3% | 8.72% | 40.7% | ★★★ |
| 224 | St. Andrew-Windfields | Toronto C12 | $924,255 | 43.62% | 60.54% | 78.7% | 283.92% | 350.2% | -2.16% | 65.4% | ★★★ |
| 225 | Kingsview Village-The Westway | Toronto W09 | $833,235 | 67.56% | 43.79% | 99.9% | 77.67% | 95.8% | 1.68% | 57.5% | ★★★ |
| 226 | Northwest Ajax | Ajax | $693,499 | 39.11% | 62.94% | 128.3% | 131.34% | 86.4% | 16.78% | 61.0% | ★★★ |
| 227 | Rolling Acres | Whitby | $985,483 | 65.81% | 63.29% | 107.1% | 109.31% | 71.9% | 10.03% | 63.0% | ★★★ |
| 228 | Bram West | Brampton | $725,980 | 27.63% | 70.61% | 143.3% | 125.04% | 102.2% | 24.61% | 59.6% | ★★★ |
| 229 | Morningside | Toronto E09 | $1,057,487 | 84.25% | 36.94% | 99.5% | 61.01% | 75.3% | -7.83% | 56.7% | ★★★ |
| 230 | Bullock | Markham | $1,206,809 | 73.07% | 39.93% | 80.2% | 90.37% | 109.6% | -21.73% | 62.6% | ★★★ |
| 231 | Clearview | Oakville | $882,396 | 29.22% | 81.91% | 111.4% | 135.59% | 125.1% | 16.45% | 72.4% | ★★★ |
| 232 | Orchard | Burlington | $119,667 | 55.27% | 55.50% | 107.0% | 99.14% | 91.5% | 12.98% | 53.5% | ★★★ |
| 233 | Farewell | Oshawa | $1,244,465 | 122.19% | 4.45% | 22.7% | 18.86% | 12.4% | -73.12% | -27.2% | ★★★ |
| 234 | Royal Orchard | Markham | $729,000 | 49.82% | 57.61% | 94.3% | 106.35% | 129.0% | -12.17% | 109.9% | ★★★ |
| 235 | Bayview Southeast | Aurora | $1,064,529 | 125.00% | 1.87% | 0.0% | 0.00% | 0.0% | -100.00% | -100.0% | ★★★ |
| 236 | Long Branch | Toronto W06 | $1,909,055 | 44.03% | 62.65% | 112.7% | 89.46% | 110.3% | 0.90% | 73.9% | ★★★ |
| 237 | Newtonbrook East | Toronto C14 | $1,465,100 | 36.30% | 68.09% | 93.1% | 160.43% | 197.9% | -10.89% | 77.6% | ★★★ |
| 238 | Henry Farm | Toronto C15 | $968,213 | 34.84% | 65.69% | 101.0% | 123.12% | 151.9% | -8.89% | 73.7% | ★★★ |
| 239 | Hurontario | Mississauga | $1,096,210 | 46.19% | 57.79% | 105.2% | 122.84% | 100.4% | 18.29% | 53.4% | ★★★ |
| 240 | Devonsleigh | Richmond Hill | $761,846 | 69.50% | 40.05% | 81.9% | 93.68% | 113.6% | -6.43% | 60.3% | ★★★ |
| 241 | Wexford-Maryvale | Toronto E04 | $1,427,376 | 79.33% | 34.72% | 100.7% | 64.02% | 79.0% | -9.05% | 55.8% | ★★★ |
| 242 | Nobleton | King | $719,327 | 43.56% | 63.35% | 93.5% | 121.99% | 148.0% | 0.47% | 68.8% | ★★★ |
| 243 | Victoria Square | Markham | $850,720 | 106.26% | 5.50% | 54.5% | 61.47% | 74.6% | -50.55% | -25.9% | ★★★ |
| 244 | Willmont | Milton | $825,833 | 58.08% | 49.59% | 106.6% | 95.59% | 88.2% | 14.59% | 40.5% | ★★★ |
| 245 | Rural Richmond Hill | Richmond Hill | $1,016,076 | 97.01% | 4.57% | 61.7% | 70.58% | 85.6% | -64.13% | -44.6% | ★★★ |
| 246 | South Riverdale | Toronto E01 | $950,569 | 68.50% | 21.96% | 90.7% | 85.39% | 105.3% | -6.10% | 42.7% | ★★★ |
| 247 | Dovercourt-Wallace Emerson-Junction | Toronto W02 | $1,037,699 | 77.63% | 23.07% | 87.1% | 79.88% | 98.5% | -4.85% | 40.1% | ★★★ |
| 248 | Credit Valley | Brampton | $934,136 | 23.95% | 70.14% | 150.9% | 131.66% | 107.6% | 28.97% | 58.8% | ★★★ |
| 249 | Aurora Village | Aurora | $1,044,761 | 82.85% | 25.94% | 81.8% | 79.83% | 96.8% | -24.71% | 49.3% | ★★★ |
| 250 | Crosby | Richmond Hill | $969,265 | 75.35% | 32.26% | 78.1% | 89.29% | 108.3% | 3.39% | 26.4% | ★★★ |
| 251 | Victoria Village | Toronto C13 | $844,949 | 83.43% | 21.43% | 67.6% | 81.45% | 100.5% | -12.90% | 42.3% | ★★★ |
| 252 | Summerhill Estates | Newmarket | $848,109 | 74.12% | 37.12% | 99.4% | 72.21% | 87.6% | 3.41% | 45.4% | ★★★ |
| 253 | Guildwood | Toronto E08 | $2,162,519 | 80.97% | 26.05% | 92.5% | 71.27% | 87.9% | -7.38% | 46.2% | ★★★ |
| 254 | Annex | Toronto C02 | $958,972 | 20.55% | 57.03% | 106.9% | 181.73% | 224.2% | 11.64% | 49.1% | ★★★ |
| 255 | Glenway Estates | Newmarket | $959,693 | 51.35% | 54.98% | 112.8% | 81.96% | 99.4% | -1.88% | 68.9% | ★★★ |
| 256 | Willowridge-Martingrove-Richview | Toronto W09 | $2,115,505 | 59.66% | 49.18% | 103.7% | 80.65% | 99.5% | 12.89% | 49.5% | ★★★ |
| 257 | Forest Hill North | Toronto C04 | $1,201,571 | 22.07% | 59.02% | 106.1% | 177.78% | 219.3% | 13.88% | 59.9% | ★★★ |
| 258 | Yorkdale-Glen Park | Toronto W04 | $1,377,618 | 27.17% | 73.77% | 132.9% | 100.98% | 124.5% | -0.47% | 83.1% | ★★★ |
| 259 | Newtonbrook West | Toronto C07 | $1,325,612 | 50.06% | 44.26% | 89.8% | 115.77% | 142.8% | 3.77% | 59.3% | ★★★ |
| 260 | Wychwood | Toronto C02 | $977,718 | 63.06% | 22.60% | 65.6% | 111.40% | 137.4% | 2.11% | 30.3% | ★★★ |
| 261 | Westminster-Branson | Toronto C07 | $1,199,256 | 83.37% | 10.25% | 63.7% | 82.17% | 101.3% | -21.79% | 24.1% | ★★★ |
| 262 | Humber Heights | Toronto W09 | $647,310 | 28.28% | 85.77% | 129.6% | 100.78% | 124.3% | 9.78% | 95.6% | ★★★ |
| 263 | Rouge Fairways | Markham | $826,742 | 112.47% | 6.09% | 49.1% | 55.32% | 67.1% | -48.19% | -8.7% | ★★★ |
| 264 | Milliken Mills West | Markham | $1,205,689 | 96.72% | 7.67% | 62.7% | 70.65% | 85.7% | -24.64% | 10.5% | ★★★ |
| 265 | Ballantrae | Whitchurch-Stouffville | $978,079 | 35.25% | 67.92% | 112.7% | 103.04% | 125.0% | -5.25% | 114.5% | ★★★ |
| 266 | College Park | Oakville | $818,679 | 63.88% | 40.16% | 90.3% | 109.90% | 101.4% | 17.65% | 16.8% | ★★★ |
| 267 | Brookhaven-Amesbury | Toronto W04 | $2,503,258 | 85.83% | 22.13% | 90.5% | 68.80% | 84.9% | -2.56% | 34.4% | ★★★ |
| 268 | Bedford Park-Nortown | Toronto C04 | $1,114,304 | 8.61% | 73.30% | 125.6% | 210.37% | 259.5% | 6.68% | 71.9% | ★★★ |
| 269 | Bayview Northeast | Aurora | $903,182 | 53.63% | 51.29% | 97.6% | 95.23% | 115.5% | 7.32% | 59.9% | ★★★ |
| 270 | Scott | Milton | $938,422 | 48.89% | 47.54% | 113.1% | 101.48% | 93.6% | 16.43% | 49.4% | ★★★ |
| 271 | Highland Creek | Toronto E10 | $937,218 | 53.34% | 37.59% | 113.4% | 78.86% | 97.3% | -10.69% | 53.7% | ★★★ |
| 272 | Applewood | Mississauga | $1,126,579 | 52.93% | 41.74% | 101.9% | 118.91% | 97.1% | 10.25% | 48.7% | ★★★ |
| 273 | Stonehaven-Wyndham | Newmarket | $760,153 | 30.56% | 67.86% | 132.5% | 96.28% | 116.8% | 5.57% | 100.2% | ★★★ |
| 274 | Kedron | Oshawa | $1,518,019 | 43.09% | 67.51% | 144.2% | 119.82% | 78.8% | -5.59% | 71.4% | ★★★ |
| 275 | Palermo West | Oakville | $938,237 | 9.95% | 91.45% | 140.1% | 170.56% | 157.4% | 28.89% | 80.6% | ★★★ |
| 276 | Brant | Burlington | $873,976 | 44.96% | 55.15% | 113.7% | 105.42% | 97.3% | 12.67% | 57.9% | ★★★ |
| 277 | Tam O'Shanter-Sullivan | Toronto E05 | $968,178 | 82.49% | 19.38% | 89.8% | 73.45% | 90.6% | -11.14% | 39.4% | ★★★ |
| 278 | Junction Area | Toronto W02 | $1,414,089 | 74.47% | 18.97% | 88.7% | 81.36% | 100.4% | -0.33% | 25.8% | ★★★ |
| 279 | Patterson | Vaughan | $835,467 | 20.37% | 78.10% | 125.1% | 120.85% | 146.6% | 24.75% | 77.7% | ★★★ |
| 280 | Humberlea-Pelmo Park W5 | Toronto W05 | $1,211,392 | 65.69% | 42.92% | 108.8% | 70.21% | 86.6% | -0.70% | 52.7% | ★★★ |
| 281 | Rose | Burlington | $908,986 | 17.10% | 91.57% | 146.8% | 136.11% | 125.6% | 27.57% | 109.9% | ★★★ |
| 282 | Steeles | Toronto E05 | $958,013 | 76.00% | 16.45% | 93.4% | 76.39% | 94.2% | -8.78% | 34.3% | ★★★ |
| 283 | Pleasant View | Toronto C15 | $832,121 | 85.36% | 12.00% | 66.1% | 80.51% | 99.3% | -12.84% | 27.8% | ★★★ |
| 284 | Headon | Burlington | $1,160,004 | 66.28% | 37.76% | 100.9% | 93.50% | 86.3% | 2.71% | 44.8% | ★★★ |
| 285 | Harding | Richmond Hill | $778,473 | 62.47% | 30.68% | 86.7% | 99.14% | 120.2% | -13.33% | 54.7% | ★★★ |
| 286 | Pottageville | King | $1,030,152 | 101.05% | 6.91% | 51.0% | 66.53% | 80.7% | -38.23% | 5.9% | ★★★ |
| 287 | Sonoma Heights | Vaughan | $1,234,296 | 67.04% | 35.36% | 91.2% | 88.04% | 106.8% | 14.52% | 22.4% | ★★★ |
| 288 | Roncesvalles | Toronto W01 | $849,709 | 53.51% | 22.54% | 92.5% | 103.73% | 127.9% | -0.35% | 35.3% | ★★★ |
| 289 | Queensville | East Gwillimbury | $1,283,280 | 78.57% | 26.29% | 94.0% | 72.62% | 88.1% | -9.09% | 52.0% | ★★★ |
| 290 | Stonegate-Queensway | Toronto W07 | $1,813,619 | 29.10% | 70.67% | 118.3% | 107.84% | 133.0% | 18.27% | 62.0% | ★★★ |
| 291 | King City | King | $806,087 | 14.70% | 83.37% | 118.8% | 154.99% | 188.0% | 11.92% | 127.4% | ★★★ |
| 292 | Agincourt North | Toronto E07 | $991,957 | 85.60% | 17.39% | 91.2% | 67.74% | 83.6% | -6.42% | 33.5% | ★★★ |
| 293 | Alton | Burlington | $934,418 | 36.18% | 59.54% | 120.2% | 111.45% | 102.8% | 27.54% | 55.6% | ★★★ |
| 294 | Highbush | Pickering | $1,021,977 | 36.12% | 68.85% | 116.9% | 147.29% | 96.9% | 17.05% | 62.9% | ★★★ |
| 295 | Middlefield | Markham | $1,316,462 | 77.22% | 24.24% | 77.5% | 87.34% | 105.9% | -2.30% | 40.9% | ★★★ |
| 296 | Observatory | Richmond Hill | $908,743 | 42.62% | 55.27% | 98.4% | 112.51% | 136.5% | 8.77% | 61.7% | ★★★ |
| 297 | Centennial Scarborough | Toronto E10 | $943,153 | 59.89% | 42.21% | 109.8% | 76.37% | 94.2% | 1.15% | 52.0% | ★★★ |
| 298 | Streetsville | Mississauga | $1,066,035 | 51.23% | 37.41% | 102.5% | 119.67% | 97.8% | 6.44% | 45.6% | ★★★ |
| 299 | Hillcrest Village | Toronto C15 | $832,235 | 75.00% | 14.52% | 73.5% | 89.59% | 110.5% | -10.44% | 33.8% | ★★★ |
| 300 | Milliken | Toronto E07 | $1,113,875 | 79.57% | 24.71% | 94.2% | 69.94% | 86.3% | 0.71% | 39.5% | ★★★ |
| 301 | Aileen-Willowbrook | Markham | $874,045 | 66.92% | 22.89% | 84.4% | 95.19% | 115.5% | -13.67% | 48.6% | ★★★ |
| 302 | Corso Italia-Davenport | Toronto W03 | $933,688 | 58.61% | 32.20% | 113.8% | 73.45% | 90.6% | -3.11% | 48.1% | ★★★ |
| 303 | L'Amoreaux | Toronto E05 | $1,013,696 | 70.43% | 24.18% | 95.9% | 78.46% | 96.8% | -1.25% | 40.6% | ★★★ |
| 304 | Iroquois Ridge South | Oakville | $1,147,845 | 56.97% | 33.26% | 93.6% | 113.90% | 105.1% | 4.63% | 20.8% | ★★★ |
| 305 | Oak Ridges Lake Wilcox | Richmond Hill | $806,554 | 63.93% | 36.12% | 85.8% | 98.10% | 119.0% | 4.52% | 49.2% | ★★★ |
| 306 | Downsview-Roding-CFB | Toronto W05 | $987,603 | 71.49% | 32.85% | 105.0% | 67.78% | 83.6% | 6.66% | 40.7% | ★★★ |
| 307 | Maple Leaf | Toronto W04 | $1,075,241 | 52.34% | 33.55% | 109.2% | 83.00% | 102.4% | -9.44% | 45.9% | ★★★ |
| 308 | Churchill Meadows | Mississauga | $1,343,578 | 29.45% | 58.55% | 116.9% | 136.42% | 111.5% | 27.15% | 53.6% | ★★★ |
| 309 | Nassagaweya | Milton | $909,570 | 12.06% | 84.95% | 168.3% | 150.96% | 139.3% | 6.22% | 95.4% | ★★★ |
| 310 | Broadview North | Toronto E03 | $1,346,758 | 79.92% | 10.83% | 89.7% | 76.44% | 94.3% | -13.34% | 19.4% | ★★★ |
| 311 | Rouge Woods | Richmond Hill | $784,158 | 39.81% | 58.31% | 100.6% | 115.10% | 139.6% | 8.19% | 66.5% | ★★★ |
| 312 | Rural Clarington | Clarington | $911,667 | 39.64% | 59.07% | 146.1% | 123.60% | 81.3% | -2.98% | 62.7% | ★★★ |
| 313 | Devil's Elbow | Markham | $989,112 | 88.99% | 3.86% | 69.1% | 77.91% | 94.5% | -79.74% | -28.5% | ★★★ |
| 314 | Erin Mills | Mississauga | $199,000 | 41.74% | 47.31% | 107.5% | 125.50% | 102.5% | 15.78% | 47.2% | ★★★ |
| 315 | Rural Oshawa | Oshawa | $1,658,597 | 120.49% | 3.10% | 37.8% | 31.37% | 20.6% | -84.26% | -65.3% | ★★★ |
| 316 | Rural Burlington | Burlington | $1,207,792 | 5.44% | 93.09% | 201.1% | 186.36% | 171.9% | 13.72% | 142.7% | ★★★ |
| 317 | Runnymede-Bloor West Village | Toronto W02 | $2,621,947 | 36.77% | 38.70% | 110.7% | 101.50% | 125.2% | 3.96% | 49.5% | ★★★ |
| 318 | Bayview Village | Toronto C15 | $1,051,898 | 1.99% | 80.04% | 180.8% | 220.34% | 271.8% | 0.22% | 96.9% | ★★★ |
| 319 | Vales of Castlemore North | Brampton | $1,059,506 | 22.89% | 62.53% | 152.9% | 133.46% | 109.0% | -2.56% | 63.8% | ★★★ |
| 320 | Clarkson | Mississauga | $810,197 | 31.38% | 50.94% | 115.2% | 134.43% | 109.8% | 25.39% | 42.3% | ★★★ |
| 321 | Northeast Ajax | Ajax | $945,429 | 42.27% | 54.22% | 124.7% | 127.71% | 84.0% | 18.02% | 55.6% | ★★★ |
| 322 | Bram East | Brampton | $1,118,251 | 32.55% | 53.40% | 137.5% | 119.95% | 98.0% | 21.81% | 54.0% | ★★★ |
| 323 | Bronte West | Oakville | $999,673 | 40.28% | 39.58% | 103.2% | 125.64% | 115.9% | 6.16% | 43.3% | ★★★ |
| 324 | East Credit | Mississauga | $595,083 | 40.69% | 52.58% | 108.7% | 126.84% | 103.6% | 17.89% | 51.1% | ★★★ |
| 325 | Thornton | Essa | $1,049,200 | 74.82% | 18.15% | 106.5% | 95.47% | 61.7% | -18.95% | 44.7% | ★★★ |
| 326 | Victoria Manor-Jennings Gate | Markham | $1,117,608 | 74.12% | 7.26% | 79.5% | 89.67% | 108.8% | -39.65% | 13.7% | ★★★ |
| 327 | Markville | Markham | $2,424,615 | 66.10% | 21.49% | 84.7% | 95.51% | 115.8% | -10.32% | 45.5% | ★★★ |
| 329 | Eastlake | Oakville | $1,112,402 | 1.46% | 88.64% | 223.8% | 272.43% | 251.3% | 16.45% | 84.2% | ★★★ |
| 330 | Markland Wood | Toronto W08 | $1,065,421 | 67.97% | 26.17% | 84.3% | 93.48% | 115.3% | -11.53% | 42.6% | ★★★ |
| 331 | Brownridge | Vaughan | $2,099,546 | 59.72% | 30.85% | 94.3% | 91.05% | 110.4% | -11.00% | 43.3% | ★★★ |
| 332 | Kingsway South | Toronto W08 | $1,353,827 | 5.15% | 81.03% | 159.2% | 176.44% | 217.6% | 14.20% | 71.4% | ★★★ |
| 333 | Jefferson | Richmond Hill | $707,044 | 38.52% | 54.63% | 101.2% | 115.70% | 140.3% | 10.51% | 60.2% | ★★★ |
| 334 | Rural Innisfil | Innisfil | $822,992 | 57.26% | 37.82% | 114.2% | 113.43% | 73.3% | -3.21% | 53.3% | ★★★ |
| 335 | York University Heights | Toronto W05 | $1,256,989 | 68.03% | 26.35% | 107.2% | 69.16% | 85.3% | -4.50% | 45.1% | ★★★ |
| 336 | Glen Abbey | Oakville | $1,186,697 | 24.65% | 57.08% | 116.0% | 141.23% | 130.3% | 32.24% | 51.6% | ★★★ |
| 337 | Don Valley Village | Toronto C15 | $1,057,905 | 65.05% | 23.89% | 81.8% | 99.73% | 123.0% | -15.31% | 48.6% | ★★★ |
| 338 | Meadowvale Village | Mississauga | $1,456,081 | 31.91% | 56.79% | 115.0% | 134.22% | 109.7% | 20.02% | 58.6% | ★★★ |
| 339 | Crestwood-Springfarm-Yorkhill | Vaughan | $1,426,676 | 16.69% | 72.60% | 128.8% | 124.44% | 150.9% | 12.73% | 115.0% | ★★★ |
| 340 | Clanton Park | Toronto C06 | $1,220,567 | 39.64% | 40.98% | 97.8% | 119.89% | 147.9% | -5.74% | 51.8% | ★★★ |
| 341 | Parkwoods-Donalda | Toronto C13 | $2,664,929 | 61.07% | 24.12% | 85.1% | 102.57% | 126.5% | 0.59% | 38.9% | ★★★ |
| 342 | Yonge-St. Clair | Toronto C02 | $1,105,721 | 6.03% | 62.76% | 131.8% | 223.95% | 276.2% | 9.57% | 61.5% | ★★★ |
| 343 | Rosebank | Pickering | $1,773,134 | 19.85% | 78.04% | 138.3% | 174.29% | 114.6% | 5.46% | 116.9% | ★★★ |
| 344 | Willowdale West | Toronto C07 | $553,368 | 16.74% | 61.94% | 115.6% | 149.01% | 183.8% | -5.73% | 76.2% | ★★★ |
| 345 | Alcona | Innisfil | $954,582 | 96.66% | 72.54% | 89.4% | 88.77% | 57.4% | 8.92% | 66.9% | ★★★ |
| 346 | Danforth | Toronto E03 | $1,184,561 | 69.50% | 13.00% | 94.1% | 80.22% | 98.9% | -10.84% | 27.2% | ★★★ |
| 347 | North Richvale | Richmond Hill | $1,039,724 | 59.84% | 24.88% | 88.5% | 101.23% | 122.8% | -0.70% | 41.7% | ★★★ |
| 348 | Fairview | Mississauga | $1,438,149 | 34.43% | 44.50% | 113.0% | 131.92% | 107.8% | 1.02% | 49.5% | ★★★ |
| 349 | Grandview | Markham | $784,794 | 28.34% | 48.36% | 109.0% | 122.91% | 149.1% | -28.59% | 85.5% | ★★★ |
| 350 | Rouge E11 | Toronto E11 | $1,151,948 | 64.70% | 26.87% | 114.8% | 65.95% | 81.3% | 5.82% | 35.6% | ★★★ |
| 351 | River Oaks | Oakville | $1,727,812 | 36.18% | 61.83% | 106.3% | 129.43% | 119.4% | 27.30% | 53.0% | ★★★ |
| 352 | Thornhill | Markham | $1,649,747 | 11.07% | 65.11% | 131.0% | 147.66% | 179.1% | -2.09% | 114.6% | ★★½ |
| 353 | Lawrence Park North | Toronto C04 | $1,365,652 | 48.24% | 19.15% | 82.8% | 138.64% | 171.0% | -2.49% | 31.3% | ★★½ |
| 354 | Palgrave | Caledon | $1,490,194 | 10.77% | 75.70% | 161.1% | 173.27% | 141.6% | -0.04% | 74.6% | ★★½ |
| 355 | Doncrest | Richmond Hill | $1,227,024 | 24.24% | 54.63% | 111.4% | 127.35% | 154.5% | -0.51% | 72.7% | ★★½ |
| 356 | East Woodbridge | Vaughan | $2,300,349 | 37.82% | 39.70% | 108.6% | 104.86% | 127.2% | 22.43% | 38.7% | ★★½ |
| 357 | Willowdale East | Toronto C14 | $1,040,104 | 16.16% | 64.05% | 112.1% | 193.32% | 238.4% | 14.68% | 65.2% | ★★½ |
| 358 | Cathedraltown | Markham | $1,113,657 | 75.06% | 16.86% | 78.8% | 88.89% | 107.8% | -17.59% | 43.7% | ★★½ |
| 359 | Milliken Mills East | Markham | $1,291,477 | 67.21% | 19.85% | 84.4% | 95.17% | 115.4% | -5.19% | 39.2% | ★★½ |
| 360 | Berczy | Markham | $2,331,685 | 44.15% | 39.64% | 97.9% | 110.37% | 133.9% | 14.81% | 39.6% | ★★½ |
| 361 | South Richvale | Richmond Hill | $1,030,576 | 3.40% | 76.05% | 174.2% | 199.27% | 241.7% | 17.03% | 116.4% | ★★½ |
| 362 | Rural East Gwillimbury | East Gwillimbury | $1,080,500 | 44.73% | 54.86% | 114.0% | 88.07% | 106.8% | -10.68% | 59.7% | ★★½ |
| 363 | Bayview Glen | Markham | $1,141,937 | 70.67% | 5.50% | 81.9% | 92.34% | 112.0% | -64.40% | -12.9% | ★★½ |
| 364 | Central Erin Mills | Mississauga | $1,700,179 | 23.83% | 44.32% | 124.1% | 144.89% | 118.4% | 12.58% | 51.2% | ★★½ |
| 365 | Yonge-Eglinton | Toronto C03 | $3,287,905 | 35.77% | 20.32% | 95.3% | 142.88% | 176.2% | -8.43% | 38.7% | ★★½ |
| 366 | Rosedale-Moore Park | Toronto C09 | $1,305,517 | 9.72% | 65.98% | 119.9% | 276.31% | 340.8% | 19.90% | 63.3% | ★★½ |
| 367 | Bronte East | Oakville | $1,488,719 | 20.61% | 50.00% | 120.5% | 146.69% | 135.3% | -12.11% | 60.6% | ★★½ |
| 368 | Buttonville | Markham | $1,282,710 | 23.01% | 57.38% | 112.9% | 127.23% | 154.3% | -11.77% | 81.1% | ★★½ |
| 369 | Westbrook | Richmond Hill | $1,902,021 | 47.60% | 26.99% | 95.9% | 109.62% | 133.0% | 1.45% | 36.9% | ★★½ |
| 370 | Lansing-Westgate | Toronto C07 | $957,683 | 12.24% | 59.02% | 124.0% | 159.84% | 197.2% | -0.86% | 62.8% | ★★½ |
| 371 | Rural Adjala-Tosorontio | Adjala-Tosorontio | $1,358,772 | 29.68% | 63.70% | 129.1% | 153.64% | 99.3% | -5.04% | 63.6% | ★★½ |
| 372 | Port Credit | Mississauga | $1,274,419 | 11.65% | 62.76% | 147.7% | 172.40% | 140.8% | 2.69% | 76.5% | ★★½ |
| 373 | Rural Oakville | Oakville | $964,466 | 23.42% | 58.31% | 117.6% | 143.19% | 132.1% | 16.26% | 60.2% | ★★½ |
| 374 | Caledon East | Caledon | $1,157,383 | 39.34% | 38.23% | 113.8% | 122.37% | 100.0% | -1.02% | 52.8% | ★★½ |
| 375 | Bayview Fairway-Bayview Country Club Estates | Markham | $1,385,491 | 62.06% | 7.49% | 87.7% | 98.91% | 120.0% | -31.65% | 11.0% | ★★½ |
| 376 | Iroquois Ridge North | Oakville | $1,587,254 | 15.63% | 54.68% | 127.9% | 155.67% | 143.6% | 15.28% | 59.2% | ★★½ |
| 377 | Unionville | Markham | $1,338,629 | 16.63% | 44.73% | 120.3% | 135.65% | 164.5% | 4.17% | 58.9% | ★★½ |
| 378 | Lambton Baby Point | Toronto W02 | $940,485 | 24.30% | 48.48% | 122.7% | 112.50% | 138.8% | 13.72% | 57.4% | ★★½ |
| 379 | Agincourt South-Malvern West | Toronto E07 | $1,452,700 | 59.13% | 24.59% | 106.5% | 79.04% | 97.5% | -7.36% | 45.1% | ★★½ |
| 380 | Islington Woods | Vaughan | $1,685,373 | 16.98% | 47.66% | 128.5% | 124.15% | 150.6% | 0.32% | 61.7% | ★★½ |
| 381 | High Park-Swansea | Toronto W01 | $1,419,900 | 13.70% | 56.50% | 126.3% | 141.63% | 174.7% | 8.94% | 58.5% | ★★½ |
| 382 | Rural Whitchurch-Stouffville | Whitchurch-Stouffville | $1,069,615 | 17.45% | 56.15% | 132.7% | 121.35% | 147.2% | -8.96% | 102.7% | ★★½ |
| 383 | Scarborough Village | Toronto E08 | $1,304,419 | 40.69% | 31.03% | 116.7% | 89.89% | 110.9% | -6.71% | 44.5% | ★★½ |
| 384 | Mill Pond | Richmond Hill | $1,837,206 | 44.44% | 25.64% | 97.5% | 111.48% | 135.2% | -19.57% | 50.6% | ★★½ |
| 385 | Leaside | Toronto C11 | $918,788 | 18.85% | 30.68% | 111.9% | 154.39% | 190.4% | 11.86% | 28.3% | ★★½ |
| 386 | LaSalle | Burlington | $1,287,180 | 48.42% | 19.73% | 111.4% | 103.23% | 95.2% | -9.69% | 42.4% | ★★½ |
| 387 | Playter Estates-Danforth | Toronto E03 | $1,139,382 | 25.41% | 31.79% | 126.9% | 108.17% | 133.4% | -3.86% | 25.2% | ★★½ |
| 388 | Erindale | Mississauga | $1,707,152 | 24.59% | 43.33% | 123.8% | 144.56% | 118.1% | 20.26% | 43.6% | ★★½ |
| 389 | Mount Pleasant West | Toronto C10 | $1,102,385 | 28.04% | 21.96% | 103.2% | 143.46% | 177.0% | -2.42% | 31.8% | ★★½ |
| 390 | Shoreacres | Burlington | $1,154,177 | 24.30% | 43.33% | 133.6% | 123.86% | 114.3% | 20.40% | 23.6% | ★★½ |
| 391 | North Riverdale | Toronto E01 | $935,596 | 46.43% | 6.97% | 103.0% | 96.99% | 119.6% | -27.05% | 2.8% | ★★½ |
| 392 | Rural Uxbridge | Uxbridge | $1,841,121 | 36.77% | 32.90% | 115.8% | 147.47% | 97.0% | -12.96% | 51.5% | ★★½ |
| 393 | Uplands | Vaughan | $791,555 | 6.32% | 54.98% | 162.9% | 157.35% | 190.8% | -17.91% | 94.3% | ★★½ |
| 394 | Rural New Tecumseth | New Tecumseth | $1,553,112 | 39.11% | 35.01% | 140.4% | 126.99% | 82.0% | -11.41% | 39.4% | ★★½ |
| 395 | Mount Pleasant East | Toronto C10 | $985,364 | 39.87% | 20.32% | 93.8% | 130.52% | 161.0% | -2.68% | 35.0% | ★★½ |
| 396 | Rougemount | Pickering | $1,516,934 | 30.09% | 33.43% | 123.3% | 155.32% | 102.1% | -18.79% | 59.1% | ★★½ |
| 397 | Princess-Rosethorn | Toronto W08 | $1,458,844 | 21.02% | 40.63% | 115.0% | 127.48% | 157.2% | 0.37% | 53.8% | ★★½ |
| 398 | Thornlea | Markham | $1,319,395 | 25.82% | 32.49% | 110.6% | 124.68% | 151.2% | -11.47% | 50.0% | ★★½ |
| 399 | Bayview Woods-Steeles | Toronto C15 | $1,052,839 | 51.35% | 17.92% | 91.0% | 110.88% | 136.8% | -5.67% | 36.1% | ★★½ |
| 400 | Dunbarton | Pickering | $1,808,538 | 23.89% | 28.57% | 131.7% | 165.96% | 109.1% | -15.49% | 52.8% | ★★½ |
| 401 | Lorne Park | Mississauga | $1,374,148 | 3.98% | 52.81% | 196.6% | 229.46% | 187.5% | 9.26% | 46.2% | ★★½ |
| 402 | The Beaches | Toronto E02 | $911,724 | 21.84% | 22.89% | 125.5% | 115.48% | 142.4% | 4.55% | 28.2% | ★★½ |
| 403 | Glen Williams | Halton Hills | $1,094,439 | 44.15% | 25.29% | 120.1% | 102.44% | 94.5% | -17.27% | 25.8% | ★★½ |
| 404 | Roseland | Burlington | $1,693,535 | 25.64% | 25.35% | 132.7% | 122.97% | 113.4% | 3.69% | 32.1% | ★★½ |
| 405 | Cachet | Markham | $1,202,331 | 12.30% | 43.68% | 128.4% | 144.73% | 175.5% | -10.74% | 66.4% | ★★½ |
| 406 | Hills of St Andrew | Aurora | $2,395,114 | 41.63% | 22.54% | 105.3% | 102.75% | 124.6% | -20.93% | 49.6% | ★★½ |
| 407 | Bayview Hill | Richmond Hill | $2,368,252 | 2.81% | 51.52% | 179.0% | 204.69% | 248.3% | -16.52% | 82.0% | ★★½ |
| 408 | Lawrence Park South | Toronto C04 | $1,932,786 | 11.89% | 23.54% | 118.8% | 199.02% | 245.5% | -10.16% | 44.1% | ★★½ |
| 409 | Old Oakville | Oakville | $1,069,546 | 3.92% | 42.10% | 178.4% | 217.16% | 200.3% | 23.56% | 41.6% | ★★½ |
| 410 | Rural Whitby | Whitby | $1,365,083 | 19.26% | 48.48% | 165.2% | 168.59% | 110.9% | 0.62% | 47.8% | ★★½ |
| 411 | Langstaff | Richmond Hill | $1,428,355 | 37.53% | 11.89% | 102.0% | 116.66% | 141.5% | -10.48% | 25.5% | ★★½ |
| 412 | Kleinburg | Vaughan | $1,100,403 | 18.74% | 30.85% | 126.4% | 122.07% | 148.1% | 21.24% | 19.6% | ★★½ |
| 413 | Tyandaga | Burlington | $1,548,100 | 24.59% | 31.32% | 133.4% | 123.64% | 114.1% | -0.16% | 37.8% | ★★½ |
| 414 | Rural King | King | $2,127,500 | 32.14% | 32.20% | 101.4% | 132.30% | 160.5% | -25.04% | 49.2% | ★★½ |
| 415 | Aurora Estates | Aurora | $1,321,537 | 3.51% | 48.48% | 186.3% | 181.82% | 220.5% | -23.27% | 64.0% | ★★ |
| 416 | High Park North | Toronto W02 | $2,012,771 | 25.41% | 28.81% | 121.1% | 111.06% | 137.0% | 6.81% | 36.7% | ★★ |
| 417 | Edenbridge-Humber Valley | Toronto W08 | $1,057,309 | 5.97% | 40.05% | 152.6% | 169.15% | 208.6% | -3.72% | 43.5% | ★★ |
| 418 | Rural Halton Hills | Halton Hills | $1,411,938 | 27.34% | 27.28% | 139.3% | 118.80% | 109.6% | -12.55% | 44.3% | ★★ |
| 419 | Beverley Glen | Vaughan | $1,140,682 | 20.67% | 27.99% | 124.9% | 120.67% | 146.4% | -12.88% | 51.3% | ★★ |
| 420 | Campbellville | Milton | $1,577,522 | 20.90% | 30.97% | 142.9% | 128.16% | 118.2% | -1.46% | 44.1% | ★★ |
| 421 | Mineola | Mississauga | $2,507,174 | 6.62% | 33.61% | 171.5% | 200.15% | 163.5% | -4.78% | 46.7% | ★★ |
| 422 | Casa Loma | Toronto C02 | $4,755,258 | 9.25% | 18.27% | 124.0% | 210.70% | 259.9% | -2.02% | 27.0% | ★★ |
| 423 | Bridle Path-Sunnybrook-York Mills | Toronto C12 | $3,757,271 | 14.81% | 36.48% | 110.8% | 399.62% | 492.9% | -7.26% | 53.2% | ★★ |
| 424 | Forest Hill South | Toronto C03 | $1,285,938 | 0.59% | 19.09% | 210.6% | 315.75% | 389.5% | -9.04% | 39.6% | ★★ |
| 425 | Sheridan | Mississauga | $2,021,124 | 15.16% | 25.35% | 139.8% | 163.16% | 133.3% | 0.12% | 38.4% | ★★ |
| 426 | Banbury-Don Mills | Toronto C13 | $1,692,740 | 6.85% | 36.89% | 140.9% | 169.85% | 209.5% | 8.80% | 48.0% | ★★ |
| 427 | Angus Glen | Markham | $1,405,262 | 12.59% | 29.04% | 128.3% | 144.66% | 175.5% | 3.29% | 42.6% | ★★ |
Affiliate (monetized) links can sometimes result in a payment to MoneySense (owned by Ratehub Inc.), which helps our website stay free to our users. If a link has an asterisk (*) or is labelled as “Featured,” it is an affiliate link. If a link is labelled as “Sponsored,” it is a paid placement, which may or may not have an affiliate link. Our editorial content will never be influenced by these links. We are committed to looking at all available products in the market. Where a product ranks in our article, and whether or not it’s included in the first place, is never driven by compensation. For more details, read our MoneySense Monetization policy.
Share this article Share on Facebook Share on Twitter Share on Linkedin Share on Reddit Share on Email


Created By
Ratehub.ca

The Bank of Canada holds its key rate steady amid the U.S. trade war and economic uncertainty.

Whether you have renters in your home or another property, know that the money you make can affect your...

Here’s how proposals from the NDP, Liberals, Conservatives and Green Party could affect your cash flow—and maybe help decide...

What to consider when deciding to incorporate a company with friends to buy real estate and more.

Sponsored By
Coast Capital

Can you retroactively change the valuation of a rental property before selling it to reduce capital gains tax in...
On the heels of a pandemic boom, the recreational real estate market has slowed. But property prices are still...