South Fraser Vancouver: Full neighbourhood ranking
Every South Fraser neighbourhood ranked
Advertisement
Advertisement
By Romana King and Mark Brown on April 11, 2017
By Romana King and Mark Brown on April 11, 2017
Every South Fraser neighbourhood ranked
Advertisement
| Rank | Neighbourhood | Area | Average price | Average price vs. area | Average price vs. metro district | Average price vs. greater city area | Value | 1-year price change | 3-year price change | 5-year price change | Momentum | Realtor grade |
|---|---|---|---|---|---|---|---|---|---|---|---|---|
| 1 | Brookswood Langley | Langley | $1,034,796 | 102.9% | 109.6% | 0.70 | 56.1% | 83.6% | 82.6% | ★★★½ | ||
| 2 | Walnut Grove | Langley | $838,826 | 83.4% | 88.8% | 0.56 | 29.0% | 54.8% | 55.8% | ★★★★ | ||
| 3 | Aldergrove Langley | Langley | $630,871 | 62.8% | 66.8% | 0.42 | 35.5% | 62.8% | 53.6% | ★★★ | ||
| 4 | Guildford | Surrey | $793,568 | 90.8% | 84.1% | 0.53 | 31.4% | 60.4% | 58.7% | ★★★½ | ||
| 5 | Fort Langley | Langley | $1,369,059 | 136.2% | 145.0% | 0.92 | 38.7% | 70.1% | 96.9% | ★★★½ | ||
| 6 | Langley City | Langley | $752,280 | 74.8% | 79.7% | 0.51 | 31.0% | 56.0% | 56.0% | ★★★ | ||
| 7 | Willoughby Heights | Langley | $1,040,875 | 103.6% | 110.2% | 0.70 | 37.7% | 68.1% | 58.6% | ★★★★ | ||
| 8 | Cloverdale | Surrey | $915,553 | 104.8% | 97.0% | 0.62 | 31.6% | 58.2% | 52.2% | ★★★★ | ||
| 9 | Fleetwood Tynehead | Surrey | $926,690 | 106.1% | 98.2% | 0.62 | 30.5% | 52.1% | 56.8% | ★★★★ | ||
| 10 | West Newton | Surrey | $794,137 | 90.9% | 84.1% | 0.53 | 28.5% | 50.8% | 60.4% | ★★★ | ||
| 11 | Murrayville | Langley | $949,342 | 94.4% | 100.6% | 0.64 | 22.9% | 46.1% | 49.6% | ★★★½ | ||
| 12 | North Surrey | Surrey | $884,083 | 101.2% | 93.6% | 0.60 | 30.5% | 55.1% | 62.0% | ★★★ | ||
| 13 | East Newton | Surrey | $806,053 | 92.3% | 85.4% | 0.54 | 29.1% | 46.1% | 54.2% | ★★★ | ||
| 14 | South Surrey White Rock | Surrey | $1,593,581 | 182.4% | 168.8% | 1.07 | 30.5% | 51.1% | 59.3% | ★★★★½ | ||
| 15 | F30A - City of Surrey combined | Surrey | $1,063,350 | 121.7% | 112.6% | 0.72 | 31.5% | 51.0% | 53.6% | ★★★★ | ||
| NR | Central Abbotsford | Abbotsford | $530,779 | 79.5% | 56.2% | 0.36 | 30.3% | 41.0% | 53.7% | NR | ||
| NR | Abbotsford West | Abbotsford | $588,825 | 88.1% | 62.4% | 0.40 | 33.7% | 50.2% | 44.5% | NR | ||
| NR | Poplar | Abbotsford | $648,914 | 97.1% | 68.7% | 0.44 | 22.4% | 21.7% | 60.4% | NR | ||
| NR | Abbotsford East | Abbotsford | $691,696 | 103.5% | 73.3% | 0.47 | 27.7% | 44.9% | 45.6% | NR | ||
| NR | Langley City | Abbotsford | $752,280 | 112.6% | 79.7% | 0.51 | 31.0% | 56.0% | 56.0% | NR | ||
| NR | Aberdeen | Abbotsford | $857,610 | 128.4% | 90.8% | 0.58 | 20.1% | 40.0% | 51.5% | NR | ||
| NR | Matsqui | Abbotsford | $960,830 | 143.8% | 101.8% | 0.65 | 14.1% | 64.6% | 48.6% | NR | ||
| NR | Sumas Mountain | Abbotsford | $996,362 | 149.1% | 105.5% | 0.67 | 6.7% | 46.4% | 49.1% | NR | ||
| NR | Sumas Prairie | Abbotsford | $1,189,500 | 178.1% | 126.0% | 0.80 | 60.0% | 75.6% | 87.9% | NR | ||
| NR | Bradner | Abbotsford | $1,592,250 | 238.3% | 168.7% | 1.07 | 28.4% | 84.6% | 47.1% | NR | ||
| NR | Port Guichon | Ladner | $938,417 | 82.4% | 54.5% | 0.63 | 31.2% | 79.9% | 95.9% | NR | ||
| NR | Delta Manor | Ladner | $970,473 | 85.2% | 56.4% | 0.65 | 27.4% | 65.0% | 61.0% | NR | ||
| NR | Holly | Ladner | $1,036,640 | 91.0% | 60.2% | 0.70 | 30.9% | 64.5% | 58.5% | NR | ||
| NR | Ladner Elementary | Ladner | $1,043,682 | 91.6% | 60.6% | 0.70 | 17.0% | 65.9% | 74.4% | NR | ||
| NR | Hawthorne | Ladner | $1,133,792 | 99.5% | 65.9% | 0.76 | 34.5% | 63.3% | 68.5% | NR | ||
| NR | Neilsen Grove | Ladner | $1,177,652 | 103.4% | 68.4% | 0.79 | 35.6% | 66.8% | 62.0% | NR | ||
| NR | F83 - Mission BC | Mission | $545,107 | 100.1% | 57.7% | 0.37 | 29.4% | 50.6% | 48.5% | NR | ||
| NR | F88 - Mission-West | Mission | $741,476 | 136.1% | 78.5% | 0.50 | 29.6% | 42.7% | 43.3% | NR | ||
| NR | Beach Grove | Tsawwassen | $1,254,905 | 89.6% | 72.9% | 0.85 | 26.8% | 88.4% | 60.8% | NR | ||
| NR | Tsawwassen Central | Tsawwassen | $1,274,528 | 91.0% | 74.1% | 0.86 | 32.8% | 91.4% | 92.7% | NR | ||
| NR | Cliff Drive | Tsawwassen | $1,364,190 | 97.4% | 79.3% | 0.92 | 47.7% | 102.2% | 112.9% | NR | ||
| NR | Pebble Hill Tsawwassen | ??? | $1,375,866 | 98.2% | 79.9% | 0.93 | 31.1% | 79.9% | 82.6% | NR | ||
| NR | Tsawwassen East Tsawwassen | ??? | $1,453,967 | 103.8% | 84.5% | 0.98 | 39.4% | 92.8% | 88.6% | NR | ||
| NR | Boundary Beach Tsawwassen | ??? | $1,536,222 | 109.6% | 89.3% | 1.03 | 25.6% | 59.4% | 53.9% | NR | ||
| NR | English Bluff Tsawwassen | ??? | $1,945,706 | 138.9% | 113.1% | 1.31 | 10.3% | 61.7% | 79.6% | NR |
Share this article Share on Facebook Share on Twitter Share on Linkedin Share on Reddit Share on Email
Advertisement

Sponsored By
Cambrian Credit Union
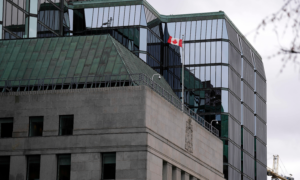
Canada’s central bank says the trade war is threatening progress on financial stability, creating higher risks and the potential...
The data behind the top places to buy real estate in Canada.

The volatility in the stock market, an insecure economy and job loss are all on the minds of young...
Advertisement